In a recent talk with the Sacramento SQL Server User Group (@SACSQLUG), a question was asked I wanted to address, and the answer seemed more like a short blog than a tweet.

I was presenting on how to use the TOP clause to break down large operations into short, fast, bite-sized operations. The mechanics are things I learned from writing processes that do garbage collection, backfill new columns, and anonymizing PII data on existing tables. I’ve just posted the slides and example scripts here if you are interested.

Are they the same?

The question was whether the SET ROWCOUNT command would work just the same, and the answer is sometimes yes but largely no.

SET ROWCOUNT will limit the number of rows returned by the following statements, and this functions like a connection level setting. It will remain in effect until you change it or clear it by setting the rowcount to 0 (unlimited).

I would be concerned about setting the option and not clearing it, causing it to affect additional statements.

So let’s adapt some of my examples and see how it behaves.

The simple case with SET ROWCOUNT

Here’s a script to return 100 rows from a table in WideWorldImporters.

USE WideWorldImporters
GO
SELECT TOP 100 
	sol.OrderLineID, 
	sol.UnitPrice 
FROM Sales.OrderLines sol 
WHERE sol.OrderLineID < 1000 
	AND sol.UnitPrice > 50;
GO

SET ROWCOUNT 100;

SELECT 
	sol.OrderLineID, 
	sol.UnitPrice 
FROM Sales.OrderLines sol 
WHERE sol.OrderLineID < 1000 
	AND sol.UnitPrice > 50;
GO

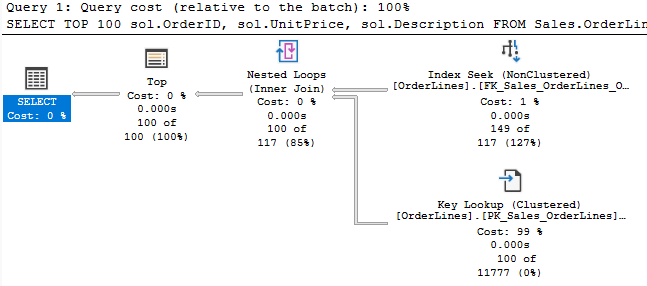
Fairly simple, and the plans are much the same.

100 rows, as promised

The only difference is that the TOP operator is missing. But the query is behaving much like it is present. I surmise that the SELECT operator itself is limiting the number of rows by not requesting additional data after the first 100.

Quick aside on Row Mode

SQL Server queries typically operate in row mode. Batch mode is used in some cases with columnstore indexes and can be used on rowstore indexes in SQL Server 2019 and above. But I want to focus on how a query processes in row mode (with thanks to Grant Fritchey for his description of this).

The activity is driven by the root node, in this latest plan the Select operator. It asks the operator under it (the Top operator) to go get a row. The Select operator doesn’t really care how that operator does what it does, it just wants a row. And for the Top operator to do it’s job, it asks the operator below it for the same.

Until we get down to the last Nested Loops operator. It asks the Index Scan operator for a row, and that operator can finally get us some data. It returns a row and, being a join operator, Nested Loops asks the Key Lookup for data related to its row. It joins the results and pass the joined row up to the operator above it.

When data flows up to an operator, it will typically reply, “Now give me another row.”

The Top operator changes this be simply not asking for more rows once it has received the number of rows it needs. So all the activity for the underlying operators stops because the Top hasn’t told it to continue.

In the simple example of my two queries, we can see the Clustered Index Seek only returned 100 rows, then the query ended. It seems with SET ROWCOUNT in effect, the Select operator itself stopped the operation by not requesting more data.

But then it falls apart

Here’s a stored procedure I wrote to delete old records from the Sales.Orders table and all related tables.

USE WideWorldImporters
GO
CREATE OR ALTER PROCEDURE Sales.Orders_GarbageCollection(
@BatchSize INT = 100,
@Duration INT = 30
)AS
SET NOCOUNT ON;

	DECLARE 
		@NestedTransaction BIT = 0,
		@EndTime DATETIME;

	CREATE TABLE #OrdersGC(
		OrderID INT,
		INDEX IX_OrdersGC(OrderID)
	);

	CREATE TABLE #InvoicesGC(
		InvoiceID INT,
		INDEX IX_InvoicesGC(InvoiceID)
	);

	SET @EndTime = DATEADD(SECOND, @Duration, GETUTCDATE());

	WHILE (GETUTCDATE() < @EndTime)
	BEGIN
		TRUNCATE TABLE #OrdersGC;
		TRUNCATE TABLE #InvoicesGC;

		IF @@NESTLEVEL > 0
		BEGIN
			SET @NestedTransaction = 1;
		END
		ELSE
		BEGIN
			BEGIN TRANSACTION;
		END;

		INSERT INTO #OrdersGC
		SELECT TOP (@BatchSize)
			so.OrderID
		FROM Sales.Orders so
		WHERE
			so.OrderDate < 
				DATEADD(month, -50, GETUTCDATE());

		DELETE sol
		FROM #OrdersGC gc
		JOIN Sales.OrderLines sol
			ON sol.OrderID = gc.OrderID;
	
		INSERT INTO #InvoicesGC
		SELECT --TOP (@BatchSize)
			inv.InvoiceID
		FROM #OrdersGC gc
		JOIN Sales.Invoices inv
			ON inv.OrderID = gc.OrderID;


			DELETE ctr
			FROM #InvoicesGC inv
			JOIN Sales.CustomerTransactions ctr
				ON ctr.InvoiceID = inv.InvoiceID;

			DELETE sti
			FROM #InvoicesGC inv
			JOIN Warehouse.StockItemTransactions sti
				ON sti.InvoiceID = inv.InvoiceID;

			DELETE invl
			FROM #InvoicesGC inv
			JOIN sales.InvoiceLines invl
				ON invl.InvoiceID = inv.InvoiceID;

		DELETE inv
		FROM #OrdersGC gc
		JOIN Sales.Invoices inv
			ON inv.OrderID = gc.OrderID;

		DELETE so
		FROM #OrdersGC gc
		JOIN Sales.Orders so
			ON so.OrderID = gc.OrderID;
		
		IF @NestedTransaction = 0
		BEGIN
			COMMIT TRANSACTION;
		END;

	END;

GO

BEGIN TRANSACTION

EXEC Sales.Orders_GarbageCollection
	@BatchSize = 100,
	@Duration = 5;

ROLLBACK TRANSACTION
GO


--CREATE INDEX IX_Sales_Orders_OrderDate ON Sales.Orders (OrderDate);

This proc identifies 100 rows in Sales.Orders that we want to delete, and puts those OrderIDs in a temp table. We then delete records from related tables based on those OrderIDs, and we similarly delete records related to rows we want to delete from Sales.Invoices. And this procedure was written to loop and keep deleting records for a specified number of seconds.

One key thing to remember is that we only use a TOP clause when we populate the first temp table. We want to delete those 100 rows and everything related to them, not those 100 rows and only 100 related rows from the related tables. If we only delete some of the related rows, our process will fail on a foreign key violation when we try to delete some rows from the Sales.Orders table.

If you were to change this to use a SET ROWCOUNT, you would need to reset that to 0 after the statement inserting into the temp table. If not, the next statement looks like this:

With SET ROWCOUNT 100

Note the Top operator in this DELETE statement. All is flowing as expected, but then the Top operator shuts this down prematurely. Top only passes on 100 rows, when then get deleted. So, later when we try to DELETE from the Sales.Orders table, we fail because we haven’t deleted all the related rows.

And you could just SET ROWCOUNT 0 once you don’t need it, but I’d be concerned I’d forget to do so and cause issues.

Also, it’s deprecated

If you take a look at the remarks section of the documentation for this statement, there’s something interesting.

Using SET ROWCOUNT will not affect DELETE, INSERT, and UPDATE statements in a future release of SQL Server. Avoid using SET ROWCOUNT with DELETE, INSERT, and UPDATE statements in new development work, and plan to modify applications that currently use it. For a similar behavior, use the TOP syntax. For more information, see TOP (Transact-SQL).

Microsoft

So they aren’t using the word deprecated here, but it amounts to that. This will stop affecting DELETE, INSERT, and UPDATE statements in future, so you wouldn’t want to write a process using SET ROWCOUNT only to have it fail at some undefined point in the future.

It doesn’t state whether this will also affect MERGE statements, but I’d rather not have to use different syntax on some statements anyway, so I’ll just stick with my TOP clauses.

Happy Holidays

Should have another post or two coming in the next few weeks thanks to some extra time off and not traveling much for the holidays. Hope yours are great.

If you have any topics related to performance in SQL Server you would like to hear more about, please feel free to make a suggestion. You can follow me on twitter (@sqljared) and contact me if you have questions.

Also, subscribe to get emails when I post again.

Since Query Store stores statistics long term, we can use it to look for trends or major changes in performance. The Query Variation component of the QDS Toolbox helps us review changes and has a lot of options to allow us to select the kinds of changes we are interested in.

So, let’s review our options and go through some examples.

Options

Let’s discuss the options and how they interact.

  • @ServerIdentifier: Defaults to the current instance. Set this to gather data from another instance of SQL Server.
  • @DatabaseName: Defaults to the current database. I’m querying data from WideWorldImporters for my examples.
  • @ReportIndex: Default NULL. When used, stores information about the parameters used for the report.
  • @ReportTable: Default NULL. Allows you to store the report data in a table like dbo.QueryVariationStore, created by the installer.
  • @Measurement: What statistic are we basing our report on? CPU by default. [CLR, CPU, DOP, Duration, Log, LogicalIOReads, LogicalIOWrites, MaxMemory, PhysicalIOReads, Rowcount, TempDB]
  • @Metric: How are we comparing our measurements? Avg by default. [Avg, Max, Min, StdDev, Total]
  • @VariationType: Are we looking for queries that have improved [I] or regressed [R]. ‘R’ by default.
  • @ResultsRowCount: Number of rows to include in the report. Default is 25.
  • @RecentStartTime and @RecentEndTime: Defines what the ‘recent’ period is, which will be compared against the historical. The defaults are 1 hour ago for @RecentStartTime, and now for @RecentEndTime.
  • @HistoryStartTime and @HistoryEndTime: Defines what the ‘history’ period is, which will be compared against the recent. The defaults are 30 days ago for @HistoryStartTime, and 1 hour ago for @HistoryEndTime.
  • @MinExecCount: Only considers queries with at least this many recent executions. Default is 1.
  • @MinPlanCount and @MaxPlanCount: Only includes queries with a number of plans in this range. Defaults are 1 and 99999.
  • @IncludeQueryText: Includes the text for any identified queries in the output. Default is 0.
  • @ExcludeAdhoc: Ignores ad hoc queries, anything that isn’t part of a procedure or other defined object. Default is 0.
  • @ExcludeInternal: Excludes internal queries\operations run by SQL Server itself. Default is 0.
  • @VerboseMode: Default 0. Provides the queries being used in the messages tab.
  • @TestMode: Default 0. When enabled, does everything except actually run the generated queries to create the report.

So let’s look at a few examples Pablo Lozano put in the header for the procedure.

Worst Regressions

The first example using the Query Variation proc creates a list of the 25 queries with the largest regression in performance for the last hour, compared to the history over the last 30 days.

	EXECUTE [dbo].[QueryVariation]
		@DatabaseName	= 'WideWorldImporters',
		@Measurement	= 'Duration',
		@Metric			= 'Avg';

We’re relying a lot on default values here, but it shows how simple it can be to run this procedure and get usable results.

Our results include queries that are in procedures and those that aren’t. We have the QueryID values for each if we want to run another query to look them up, but we didn’t include the option to get the text for the statements.

Since the default is to look for regressed queries, our list has 25 queries in descending order based on how large the regression was. We can see the average duration recently and historically, the number of executions is each window, and the overall number of plans.

The first two queries on this list from Integration.GetCustomerUpdates both have regressed by almost 300%. Both also have two execution plans. That could be the explanation for their regression; we could have a new plan that is worse for a variety of reasons. We also are comparing 8 recent executions to 100 in our history, so it could just be the small sample size (or cold cache) is making a big difference.

We have the information we need here to find the query and follow up from there. I’m fond of using the “Tracked Queries” report in SSMS under Query Store, and that would show us the query and it’s recent plans.

Biggest CPU Improvements

Here’s the second example from the procedure’s comments.

		EXECUTE [dbo].[QueryVariation]
			@DatabaseName	= 'WideWorldImporters',
			--@ReportIndex		= '[dbo].[QueryVariationIndex]',
			--@ReportTable		= '[dbo].[QueryVariationReport]',
			@Measurement		= 'CPU',
			@Metric				= 'Total',
			@VariationType		= 'I',
			@ResultsRowCount	= 10,
			@MaxPlanCount		= 1,
			@IncludeQueryText	= 1;

I’ve added my database name and left the report tables in comments, and I did change the option to include query text.

This report should show us queries that have improved the most, based on total CPU usage. It will only give us 10 results, and only includes query with a single plan.

Results here are showing us procedure with the biggest reduction in overall CPU usage, and several are around 90%. But, that’s not surprising since we measured off the total numbers instead of average, and we’ve run the queries far less in the recent window. If we run the query 92% less in the recent window, this will show up as a reduction.

If our executions were more even, it could draw attention to statements that have improved despite the plan not changing, since we set our @MaxPlanCount to 1.

The QuerySQLText has information on variables at the beginning, but we see which statement is being referred to by each line of the report.

Query Variation Usage

The Query Variation report is good for a general comparison of performance. Run this daily, check your average duration\CPU\logical IO reads against the historical to look for regressions, and you get a good list of queries and procs you may want to look into.

Do keep in mind that you can’t use this check the results of a change to a query. If you are changing the text of a statement in any way, the modified statement is a different query_id in Query Store. So this report wouldn’t compare it to the original statement.

This can identify queries that have a change in performance because of a new plan, depending on how you set the @MaxPlanCount. So if you are changing an index to improve a query, a query variation report could show the statement’s improvement (or regression).

Speaking at SQL Friday this week

If you are not aware of SQL Friday, there’s a talk done online live every week at noon CET (GMT +6). You can also view previous sessions through links here.

I’ll be speaking this week with a case study on optimizing a very frequently run procedure. It is the same subject I presented at Virtual PASS 2021.

I have a few more blogs coming on the QDS Dashboard, and a few other topics I’m likely to write on soon. If you have any topics related to performance in SQL Server you would like to hear more about, please feel free to make a suggestion. You can follow me on twitter (@sqljared) and contact me if you have questions.

In contrast to the previous QDS Toolbox components, this one is relatively simple. Instead of a tool that’s ready to be scheduled to give you a report, this just adds the dbo.query_store_wait_stats_pivoted view.

So, what’s the value here?

The typical case

The way I use Query Store most often, is to investigate the performance of a specific procedure or statement. I tend to do this when I know there is an issue, or when I want to evaluate the improvement of a new change.

Here’s a query I’ll often run (or some variation thereof):

--Statement numbers for the last two hours, no aggregation
SELECT 
	qrs.avg_duration * qrs.count_executions AS total_duration,
	qrs.count_executions, 
	qrs.avg_duration, 
	qsq.query_id,
	qsi.end_time,
	qt.query_sql_text, 
	qsq.query_hash
FROM sys.query_store_query qsq 
JOIN sys.query_store_query_text qt 
	ON qt.query_text_id = qsq.query_text_id
JOIN sys.query_store_plan qp 
	ON qp.query_id = qsq.query_id
JOIN sys.query_store_runtime_stats qrs 
	ON qp.plan_id = qrs.plan_id
JOIN sys.query_store_runtime_stats_interval qsi
	ON qsi.runtime_stats_interval_id = qrs.runtime_stats_interval_id
WHERE 
	qsq.object_id = OBJECT_ID('Integration.GetStockItemUpdates')
	AND qsi.end_time > DATEADD(hour, -2, GETUTCDATE())
	--AND qt.query_sql_text LIKE '%something%'
ORDER BY 
	qt.query_sql_text, 
	qsq.query_id,
	qsi.end_time

Now, Query Store’s performance statistics are separated into intervals. We can set the size for an interval when we turn on Query Store (60 minutes by default, I have it at 15 on my test environment). So, this query will show me the performance of each statement for each interval over the last two hours.

Sometimes I’ll aggregate the data so I can look at the averages over several days, but sometimes I like seeing each interval to see if there is a lot of variation.

So, here’s that result set:

Runtime Stats from Query Store

sys.query_store_wait_stats

But let’s say we look at this data and are concerned one of these statements is taking longer than expected, and we want to see if it is waiting on anything. So, we take that query and add a join to sys.query_store_wait_stats. Seems simple enough.

--Statement numbers for the last two hours, no aggregation, with wait stats for one statement
SELECT 
	qrs.avg_duration * qrs.count_executions AS total_duration,
	qrs.count_executions, 
	qrs.avg_duration, 
	qsq.query_id,
	qsi.end_time,
	qt.query_sql_text, 
	ws.wait_category_desc,
	ws.execution_type_desc,
	ws.total_query_wait_time_ms,
	ws.avg_query_wait_time_ms
FROM sys.query_store_query qsq 
JOIN sys.query_store_query_text qt 
	ON qt.query_text_id = qsq.query_text_id
JOIN sys.query_store_plan qp 
	ON qp.query_id = qsq.query_id
JOIN sys.query_store_runtime_stats qrs 
	ON qp.plan_id = qrs.plan_id
JOIN sys.query_store_runtime_stats_interval qsi
	ON qsi.runtime_stats_interval_id = qrs.runtime_stats_interval_id
LEFT JOIN sys.query_store_wait_stats ws
	ON ws.plan_id = qrs.plan_id
	AND ws.runtime_stats_interval_id = qsi.runtime_stats_interval_id
WHERE 
	qsq.object_id = OBJECT_ID('Integration.GetStockItemUpdates')
	AND qsi.end_time > DATEADD(day, -2, GETUTCDATE())
ORDER BY 
	qt.query_sql_text, 
	qsq.query_id,
	qsi.end_time,
	ws.wait_category_desc

And let’s see our results:

Runtime Stats with Wait Stats

Now we have 9 rows instead of 5. And the number under avg_duration look redundant.

What’s happened, is that sys.query_store_wait_stats has multiplied our result set. Since it stores a record for each wait type observed in each interval, we have multiple combined rows for several of these intervals. And one of our rows would have been removed from this set if we didn’t LEFT JOIN to sys.query_store_wait_stats, since it had no waits.

This is probably not how you would image it to work on first glance. And you might want to pivot those results instead, but the Pivoted Wait Stats view has done that for you.

Using Pivoted Wait Stats

If I take my original query and join to dbo.query_store_wait_stats_pivoted, I will get one row of output for each plan_id and runtime_stats_interval_id.

And the result set will be rather wide. There’s a total and average column for each wait type in sys.query_store_wait_stats. You may or may not want to include all in your query.

So, here’s an example with the average for several interesting wait types:

--Statement numbers for the last two hours, no aggregation
SELECT 
	qrs.avg_duration * qrs.count_executions AS total_duration,
	qrs.count_executions, 
	qrs.avg_duration, 
	qsq.query_id,
	qsi.end_time,
	qt.query_sql_text, 
	wsp.Average_BufferIO,
	wsp.Average_BufferLatch,
	wsp.Average_CPU,
	wsp.Average_Lock,
	wsp.Average_Memory,
	wsp.Average_NetworkIO,
	wsp.Average_Parallelism,
	wsp.Average_Tracing
FROM sys.query_store_query qsq 
JOIN sys.query_store_query_text qt 
	ON qt.query_text_id = qsq.query_text_id
JOIN sys.query_store_plan qp 
	ON qp.query_id = qsq.query_id
JOIN sys.query_store_runtime_stats qrs 
	ON qp.plan_id = qrs.plan_id
JOIN sys.query_store_runtime_stats_interval qsi
	ON qsi.runtime_stats_interval_id = qrs.runtime_stats_interval_id
LEFT JOIN dbo.query_store_wait_stats_pivoted wsp 
	ON wsp.plan_id = qp.plan_id
	AND wsp.runtime_stats_interval_id = qrs.runtime_stats_interval_id
WHERE 
	qsq.object_id = OBJECT_ID('Integration.GetSaleUpdates')
	AND qsi.end_time > DATEADD(day, -5, GETUTCDATE())
ORDER BY 
	qt.query_sql_text, 
	qsq.query_id,
	qsi.end_time

Runtime Stats with Pivoted Wait Stats

We have one record for this query for each of three intervals. In each row, I can see the average wait time for CPU, disk (BufferIO), buffer latch, and other waits. In this case, the largest waits were with NetworkIO. Likely, SSMS was having trouble keeping up with displaying multiple result sets, because I ran this batch 50 times in a row.

One last thing, keep in mind the times from the main tables in Query Store like sys.query_store_runtime_stats are reported in microseconds, while the wait tables are in milliseconds whether you use sys.query_store_wait_stats or dbo.query_store_wait_stats_pivoted. A query that takes 7,000,000 microseconds to run but waited for CPU time for 6,900 milliseconds spent nearly its entire duration waiting.

Don’t forget about PASS Data Community Summit 2021!

PASS Data Community Summit 2021 is next week, and the event is virtual and free, so please go and register if you haven’t already. I’m happy to see PASS and the summit are Red Gate’s hands, and expect it to be a great event.

Many of the sessions, including my session, are prerecorded and can be watched at any time. This should make it easier to get around conflicts between sessions you want to hear. There are also Q&A sessions for the prerecorded sessions, and those are scheduled and live. So get registered and make sure you don’t miss out.

If you have any topics related to performance in SQL Server you would like to hear more about, please feel free to make a suggestion. You can follow me on twitter (@sqljared) and contact me if you have questions.