When configuring Query Store, we have a few options for deciding how it retains data but little control over how it cleans up that data. We can set the max size of our query store, the max number of plans to keep per query, and how long to keep query statistics.
The QDS Cache Cleanup component of the QDS Toolbox gives us a number of other options for what data to remove:
- Internal queries
- Adhoc queries
- Orphaned queries (from deleted stored procedure and other dropped objects)
- Queries that have not run recently
- Target queries with fewer than X executions
- Remove only stats associated with targeted queries
Performance
There was a performance issue where I work that related to the QDS size-based cleanup that Mark Wilkinson discusses here. There were a number of symptoms and issues seen at the time and hats off to our DBAs for determining the root cause. This is something I wanted to highlight.
These issues didn’t start until QDS started hitting max size, so that was over a month in some cases, and it didn’t hit all instances and databases at the same time. This means the issue seemed “random” when it was happening.
Mark Wilkinson
Using the QDS Cache Cleanup, you can prevent the typical size-based cleanup from running, while having more control on what gets cleaned up. The procedure provided will identify which queries or stats in Query Store to remove, then calls system procedures to remove them:
- sp_query_store_unforce_plan
- sp_query_store_remove_query
- sp_query_store_reset_exec_stats
Options
Let’s discuss the options and how they interact.
- @InstanceIdentifier: You can use this to gather data from another instance of SQL Server.
- @DatabaseName: Defaults to the current database. I keep my QDS data in a separate database, so I will use it in my examples.
- @CleanAdhocStale: Binary option; default is 0. Setting this to 1 will clean up data related to any stale queries that are ad-hoc queries, i.e. not associated with an object like a stored procedure. Only stale ad-hoc queries are affected, as defined by the @Retention and @MinExecutionCount.
- @CleanStale: Binary option; default is 1. Cleans up all stale queries. Also depends on the settings for @Retention and @MinExecutionCount.
- @Retention: This setting helps define which queries are considered “stale”. Takes in a number of hours since the query was last run. The default is 168 hours (a week), meaning any query that had run in the last week would not count as stale. If you set this to 0, it will include all queries that match the @CleanStale/@CleanAdhocStale options.
- @MinExecutionCount: Queries with fewer than this many executions are stale. Default is 2. So, if we take both default options, this will clean up queries with less than 2 executions and anything that has not run in the last week. Setting this to 0, again, would include all queries or all ad-hoc queries.
- @CleanInternal: Binary option; default is 1. Cleans up any internal queries. This includes queries being run by SQL Server itself to do things like update statistics, and is based on a filter on sys.query_store_query.is_internal_query. This isn’t a “stale” option, so @Retention and @MinExecutionCount don’t affect this.
- @CleanOrphan: Binary option; default is 1. Cleans up any queries that are associated with an object that no longer exists.
- @CleanStatsOnly: Binary option; default is 0. When enabled, this option doesn’t remove the query and plan, but uses sp_query_store_reset_exec_stats to remove the statistics for any targeted queries. When not enabled, the default behavior unforces any forced plans with sp_query_store_unforce_plan, and then removes the query, its plans, and its execution statistics with sp_query_store_remove_query. Applies to any query included by the above options.
- @ReportAsText and @ReportAsTable: Both default to 0. You can enable either or both to get details on the amount of space recovered from the cleanup, in whichever format you prefer.
- @ReportIndexOutputTable: Default NULL. Setting this allows you to store the report data in a table like dbo.QDSCacheCleanupIndex, created during setup.
- @ReportDetailsAsTable: Default 0. When enabled, returns details about each query being deleted from Query Store.
- @ReportDetailsOutputTable: Default NULL. allows you to store the report details in a table like dbo.QDSCleanSummary, created during setup.
- @TestMode: Default 0. Doesn’t actually delete data, but provides output as though it does. You could use this to see what the effect of a given set or parameters would be before actually taking a destructive action.
- @VerboseMode: Default 0. Provides the queries being used in the messages tab.
One point for clarity, if the @Retention or @MinExecutionCount is 0,
QDS Cache Cleanup examples:
EXECUTE [dbo].[QDSCacheCleanup]
	@DatabaseName = 'WideWorldImporters'
	,@CleanAdhocStale = 0
	,@CleanStale = 1
	,@Retention = 24
	,@MinExecutionCount = 2
	,@CleanOrphan = 1
	,@CleanInternal = 1
	,@ReportAsTable = 1
	,@ReportDetailsAsTable = 1
	,@TestMode = 1;
GO
This is a example execution given in the comments of the procedure. Since this is run in test mode, nothing is actually deleted; the reports provided give information on what would be deleted if we ran this process normally.
CleanAdhocStale is not used, but CleanStale is a superset of it; so stale ad-hoc queries are included with all stale queries. Anything that has been executed at least twice in the last day is not considered stale.
This process does include any queries from dropped objects and any internal queries, regardless of when they were executed.

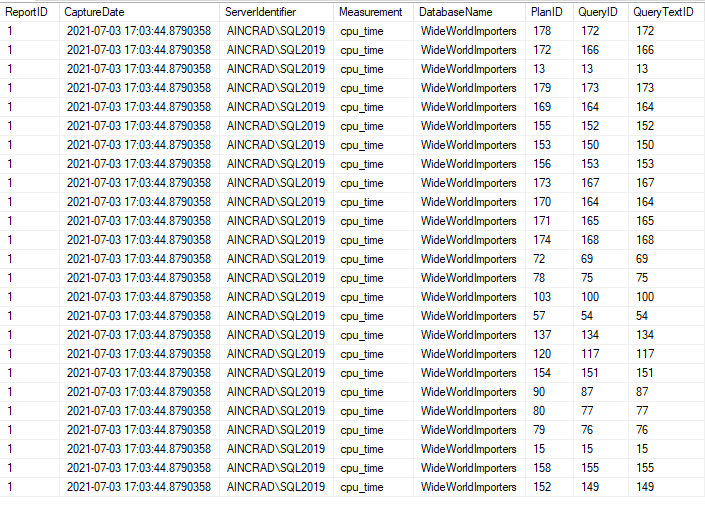
The report from the QDS Cache Cleanup gives one line per type of query affected. The output includes when this was generated and where, along with the count of queries and plans cleaned up and the space that would be recovered.
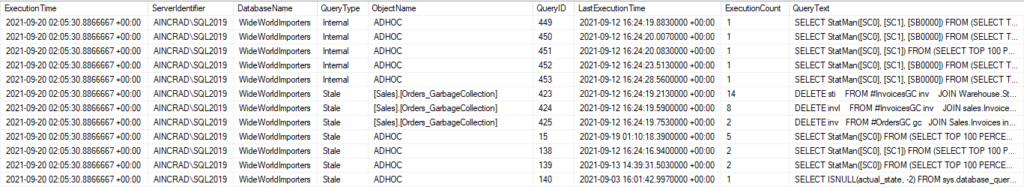
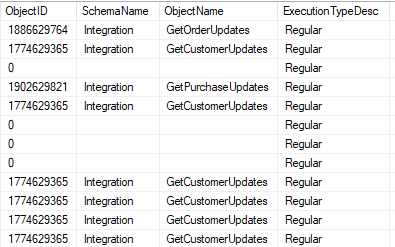
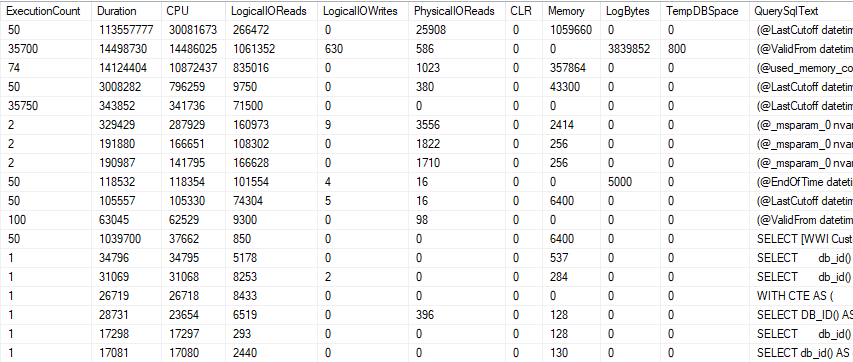
The report details shows the object name (where possible), Query ID, LastExecutionTime, ExecutionCount and QueryText for all queries included in the cleanup.
In my case, it found queries from a procedure I was testing recently (though I had to up the execution count so there would be some stale queries). Most of what the QDS Cache Cleanup flagged for deletion were internal queries involved in updating stats. But nothing was removed, since this was still in TestMode.
There were also some stale ad-hoc queries that look like statistics activity (you can see StatMan in the QueryText). These are internal queries but had executed few times and not recently, so they were also flagged as stale.
This raises an important point. Based on the @Retention and @MinExecutionCount options, orphaned or internal queries can count as stale and be included in your cleanup. If either setting is 0, all queries will be included by the QDS Cache Cleanup; essentially a full wipe of Query Store.
Here’s a few more examples with comments:
USE QDSToolBox
GO
	-- Test Mode; no deletion
	-- Includes Stale queries (24 hours or < 20 executions)
	-- Also includes orphaned and internal queries
	-- Provides report, details, and verbose output (Messages tab)
EXECUTE [dbo].[QDSCacheCleanup]
	@DatabaseName = 'WideWorldImporters'
	,@Retention = 24
	,@MinExecutionCount = 20
	,@CleanStale = 1
	,@CleanAdhocStale = 0
	,@CleanOrphan = 1
	,@CleanInternal = 1
	,@ReportAsTable = 1
	,@ReportDetailsAsTable = 1
	,@TestMode = 1
	,@VerboseMode = 1;
GO

	-- Test Mode; no deletion
	-- Only includes orphaned and internal queries
	-- Provides report, details, and verbose output (Messages tab)
EXECUTE [dbo].[QDSCacheCleanup]
	@DatabaseName = 'WideWorldImporters'
	,@CleanStale = 0
	,@CleanOrphan = 1
	,@CleanInternal = 1
	,@ReportAsTable = 1
	,@ReportDetailsAsTable = 1
	,@TestMode = 1
	,@VerboseMode = 1;
GO

	-- Test Mode; no deletion
	-- Disables most default options
	-- Only includes ad-hoc queries only executed once
	--		and not run in the last 24 hours.
	-- Provides report, details, and verbose output (Messages tab)
EXECUTE [dbo].[QDSCacheCleanup]
	@DatabaseName = 'WideWorldImporters'
	,@Retention = 24
	,@MinExecutionCount = 2
	,@CleanStale = 0
	,@CleanAdhocStale = 1
	,@CleanOrphan = 0
	,@CleanInternal = 0
	,@ReportAsTable = 1
	,@ReportDetailsAsTable = 1
	,@TestMode = 1
	,@VerboseMode = 1;
GO

	-- Test Mode; no deletion
	-- @CleanStale = 1, other clean uptions disabled
	-- Setting @Retention or @MinExecutionCount to 0 means all queries are stale
	-- Output table options included but commented.
	-- Provides report, details, and verbose output (Messages tab)
DECLARE
	@ReportID BIGINT;

	EXECUTE [dbo].[QDSCacheCleanup]
		@DatabaseName = 'WideWorldImporters',
		@CleanAdhocStale = 0,
		@CleanStale = 1,
		@Retention = 0,			--	All Queries Stale
		@MinExecutionCount = 0,	--	All Queries Stale
		@CleanOrphan = 0,
		@CleanInternal = 0,
		@CleanStatsOnly	= 0,
		@ReportAsText = 1,
		@ReportAsTable = 1,
		@ReportDetailsAsTable = 1,
		--@ReportIndexOutputTable	= '[dbo].[QDSCacheCleanupIndex]',
		--@ReportDetailsOutputTable	= '[dbo].[QDSCacheCleanupDetails]',
		@TestMode = 1,
		@VerboseMode = 1,
		@ReportID = @ReportID OUTPUT;

SELECT @ReportID;
GO
More to come
Some of the options in the QDS Cache Cleanup didn’t function like I expected at first, so I think this post should be helpful. I’ll continue to post on the QDS Dashboard, but I’ll likely include a few on other topics in the weeks to come.
I will be speaking at PASS Summit, which is free and virtual this year, so please sign up if you haven’t already.
If you have any topics related to performance in SQL Server you would like to hear more about, please feel free to make a suggestion. You can follow me on twitter (@sqljared) and contact me if you have questions.