The QDS Toolbox
The QDS Toolbox is set of tools that can help you review and store the performance related data in Query Store. This was released by ChannelAdvisor last September thanks to the hard work of a number of my coworkers.
If you aren’t experienced with Query Store, this can provide a good starting point for getting familiar with data that is available and what you can do with it. If you are experienced with Query Store, this may give you an easy way to set up customizable reports that help you find issues and see trends.
The QDS Toolbox has several components, and I intend to post about each in turn. Two new components were added to this recently by @sqlozano (https://www.sqlozano.com/), bringing the current total to eight.
- Server Top Queries
- Query Waits
- QDS Cache Cleanup
- Pivoted Waits Stats
- Query Variation
- Waits Variation
- Statistics Used
- Plan Miner
Getting Started
First things first, let’s get it downloaded and installed. I’ve linked the github page above. You can download a ZIP of the current package, or you can clone it with GitHub Desktop or a similar tool.
Once you have the package local, there’s an Installer folder. You could install them a la carte, or the QDSToolBox_Installer script will install all of the components. It will prompt you for the instance of SQL Server you want to use as well as the database you want to install it in. I’m putting mine in it’s own database, as I frequently restore other databases (WideWorldImporters, AdventureWorks2014) when I’m testing things.
Moving to Query Store
In my own experience with performance tuning with SQL Server, I started off using Profiler and PSSDiag constantly when I worked for Microsoft. After a number of years, I moved a lot of my focus to using queries against DMVs (Dynamic Management Views). DMVs allowed me to get most of the same data I reviewed from PSSDiag, but I’m able to get that data with a query that takes a few seconds (typically) instead of having to gather a trace for 30 minutes to feel like I have enough data.
By focusing on a DMV like sys.dm_exec_query_stats, you can easily find which queries on your server have the highest CPU usage, duration, or logical reads. This can make if very easy to identify a problem query, and you can find the query even if it isn’t running currently.
The caveat is that the DMVs only track what is in the cache, and once a query’s plan is no longer cached, it’s gone. No historical data is kept in the DMVs, and that’s why I use Query Store almost exclusively these days.
Server Top Queries
This is a great place to start exploring what is available in the QDS Toolbox, because looking for the top resource consuming queries is a common task.
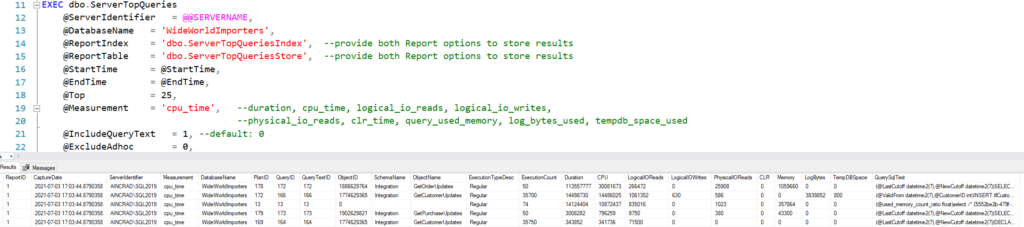
Once you have the tool installed, you can run the dbo.ServerTopQueries to generate reports based on the metric you choose. That report will remain in the database where the QDS Toolbox was installed, and you can review them whenever. Here’s an example execution of the procedure:
USE QDSToolBox
GO
DECLARE
	@StartTime DATETIME2,
	@EndTime DATETIME2;

SELECT
	@StartTime = DATEADD(DAY,-1,GETUTCDATE()),
	@EndTime = GETUTCDATE();

EXEC dbo.ServerTopQueries
	@ServerIdentifier	= @@SERVERNAME,
	@DatabaseName	= 'WideWorldImporters',
	@ReportIndex	= 'dbo.ServerTopQueriesIndex',	--provide both Report options to store results
	@ReportTable	= 'dbo.ServerTopQueriesStore',	--provide both Report options to store results
	@StartTime		= @StartTime,
	@EndTime		= @EndTime,
	@Top			= 25,
	@Measurement	= 'cpu_time',	--duration, cpu_time, logical_io_reads, logical_io_writes,
									--physical_io_reads, clr_time, query_used_memory, log_bytes_used, tempdb_space_used
	@IncludeQueryText	= 1, --default: 0
	@ExcludeAdhoc		= 0,
	@ExcludeInternal	= 0,
	@VerboseMode		= 1,
	@TestMode			= 0;

GO

DECLARE
	@LatestReport INT;

SELECT TOP 1
	@LatestReport = tqi.ReportID
FROM dbo.vServerTopQueriesIndex tqi
ORDER BY
	tqi.CaptureDate DESC;

SELECT *
FROM dbo.vServerTopQueriesStore tqs
WHERE
	tqs.ReportID = @LatestReport
ORDER BY
	tqs.CPU DESC;
GO
This script will run in the QDSToolbox database and store the report there, but we will be gathering the Query Store data on activity in the WideWorldImporters databse. I’ve just run some scripts there to generate activity.
The @StartTime and @EndTime parameters will restrict us to looking at activity in the last day.
The @ReportIndex and @ReportTable parameter define where we will store the data. I’ve left these at the default names for the tables, as defined by the tool.
The report is going to be focusing on high cpu queries, defined by the @Measurement variable being set to ‘cpu_time’. If I were using this, I’d be very likely to use ‘duration’ and ‘logical_io_reads’ often as a matter of course as well.
The @Top parameter is set to 25, and that’s probably reasonable. If I’m troubleshooting an active problem, I’d be unlikely to look at more than the top 5 queries in whatever metric, but a larger view makes sense for historical purposes.
I’m taking the default option for @ExcludeAdhoc and @ExcludeInternal; if it’s at the top of my CPU usage, I want to see it.
I am setting @IncludeQueryText to 1 so I get the query_store_query_text.query_sql_text details in my report. That may help you identify a specific query. Even without this option the query_store_query.query_text_id will be available, so you could look up the exact query text directly in Query Store.
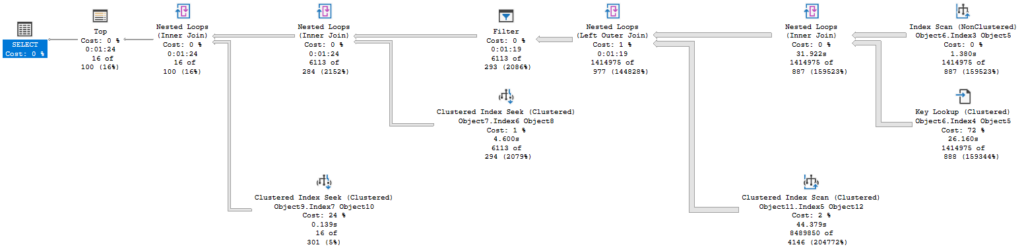
I’ve also enabled @VerboseMode to see the exact statement used to generate the report. If you are less familiar with Query Store, you might want to review this to see where all the data being used here is found.
With all this, generating the report took less than a second. Certainly you could set up a scheduled take to create a report on CPU activity every day, which you could review\aggregate\splice later. You could create tasks to do the same for ‘duration’ and ‘logical_io_reads’ and have a good set of data to review for potential issues.
Reviewing the report
Here’s a short script to view my latest report and all the data in the dbo.vServerTopQueriesStore view:
SELECT TOP 1
	@LatestReport = tqi.ReportID
FROM dbo.vServerTopQueriesIndex tqi
ORDER BY
	tqi.CaptureDate DESC;

SELECT *
FROM dbo.vServerTopQueriesStore tqs
WHERE
	tqs.ReportID = @LatestReport
ORDER BY
	tqs.CPU DESC;
GO
Report Output
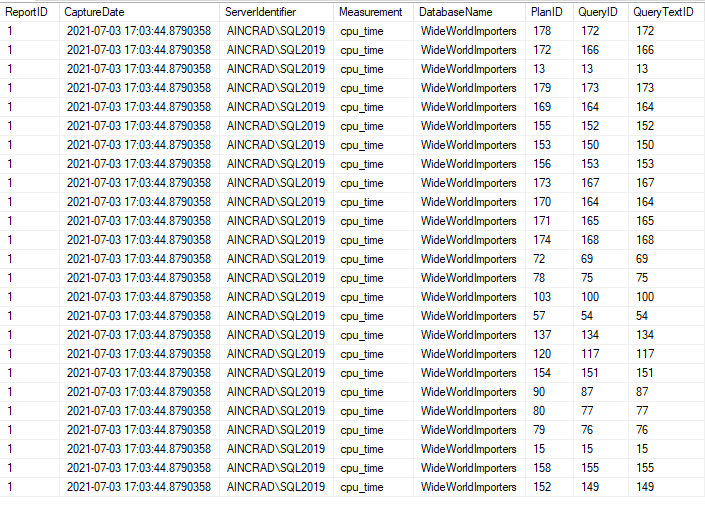
The result set includes the capture date for the report, which is the same for each row. We also have the server name, database name, and metric used for the report.
The PlanID, QueryID, and QueryTextID are values you can use to get more information directly from Query Store. I frequently use the QueryID in particular with the Tracked Queries interface in SQL Server Management Studio to look at the plan for a query I’ve already identified.
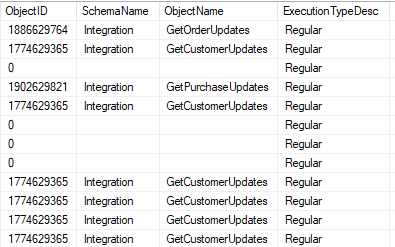
We will see the ObjectName, ObjectID, and SchemaName for any queries that are part of a procedure, function, or other object.
The ExecutionTypeDesc here indicates these queries ran successfully. This value could also be ‘Aborted’ (for a timeout) or ‘Exception’ (for an error).
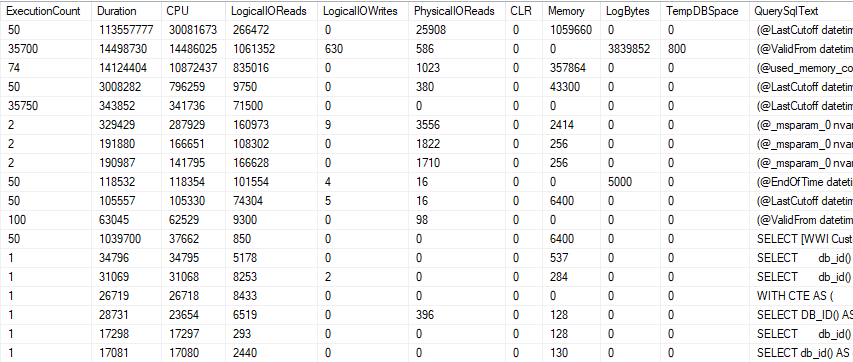
And here we have all of our performance statistics along with the query text. I most often look at three of these, but this includes memory usage (in pages), tempdb usage (also in pages), and log bytes.
The execution count is included, so you can use this to calculate averages for any of these measurements. I tend to focus on the queries that have the highest numbers overall, but you may find a query farther down on your list with a longer average duration is more important.
Coming up
These reports will be used as well by other aspects of the QDS Toolkit, so understanding how to create the reports themselves will be necessary for those.
As I’ve said, there are 7 more parts to this tool. I’m planning to do a post on each in the weeks (and months) ahead. I’ll also be doing more “foundation” posts like my last post on key lookups.
I hope you find this post helpful. If you have any topics related to performance in SQL Server you would like to hear more about, please feel free to make a suggestion.
You can follow me on twitter (@sqljared) and contact me if you have questions.