Since Query Store stores statistics long term, we can use it to look for trends or major changes in performance. The Query Variation component of the QDS Toolbox helps us review changes and has a lot of options to allow us to select the kinds of changes we are interested in.
So, let’s review our options and go through some examples.
Options
Let’s discuss the options and how they interact.
- @ServerIdentifier: Defaults to the current instance. Set this to gather data from another instance of SQL Server.
- @DatabaseName: Defaults to the current database. I’m querying data from WideWorldImporters for my examples.
- @ReportIndex: Default NULL. When used, stores information about the parameters used for the report.
- @ReportTable: Default NULL. Allows you to store the report data in a table like dbo.QueryVariationStore, created by the installer.
- @Measurement: What statistic are we basing our report on? CPU by default. [CLR, CPU, DOP, Duration, Log, LogicalIOReads, LogicalIOWrites, MaxMemory, PhysicalIOReads, Rowcount, TempDB]
- @Metric: How are we comparing our measurements? Avg by default. [Avg, Max, Min, StdDev, Total]
- @VariationType: Are we looking for queries that have improved [I] or regressed [R]. ‘R’ by default.
- @ResultsRowCount: Number of rows to include in the report. Default is 25.
- @RecentStartTime and @RecentEndTime: Defines what the ‘recent’ period is, which will be compared against the historical. The defaults are 1 hour ago for @RecentStartTime, and now for @RecentEndTime.
- @HistoryStartTime and @HistoryEndTime: Defines what the ‘history’ period is, which will be compared against the recent. The defaults are 30 days ago for @HistoryStartTime, and 1 hour ago for @HistoryEndTime.
- @MinExecCount: Only considers queries with at least this many recent executions. Default is 1.
- @MinPlanCount and @MaxPlanCount: Only includes queries with a number of plans in this range. Defaults are 1 and 99999.
- @IncludeQueryText: Includes the text for any identified queries in the output. Default is 0.
- @ExcludeAdhoc: Ignores ad hoc queries, anything that isn’t part of a procedure or other defined object. Default is 0.
- @ExcludeInternal: Excludes internal queries\operations run by SQL Server itself. Default is 0.
- @VerboseMode: Default 0. Provides the queries being used in the messages tab.
- @TestMode: Default 0. When enabled, does everything except actually run the generated queries to create the report.
So let’s look at a few examples Pablo Lozano put in the header for the procedure.
Worst Regressions
The first example using the Query Variation proc creates a list of the 25 queries with the largest regression in performance for the last hour, compared to the history over the last 30 days.
	EXECUTE [dbo].[QueryVariation]
		@DatabaseName	= 'WideWorldImporters',
		@Measurement	= 'Duration',
		@Metric			= 'Avg';
We’re relying a lot on default values here, but it shows how simple it can be to run this procedure and get usable results.
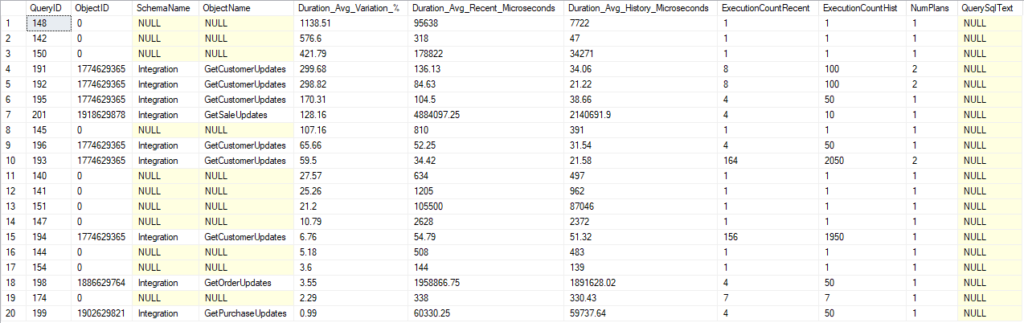
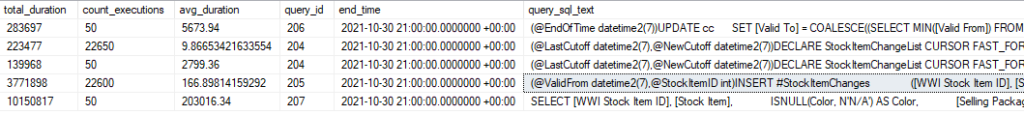
Our results include queries that are in procedures and those that aren’t. We have the QueryID values for each if we want to run another query to look them up, but we didn’t include the option to get the text for the statements.
Since the default is to look for regressed queries, our list has 25 queries in descending order based on how large the regression was. We can see the average duration recently and historically, the number of executions is each window, and the overall number of plans.
The first two queries on this list from Integration.GetCustomerUpdates both have regressed by almost 300%. Both also have two execution plans. That could be the explanation for their regression; we could have a new plan that is worse for a variety of reasons. We also are comparing 8 recent executions to 100 in our history, so it could just be the small sample size (or cold cache) is making a big difference.
We have the information we need here to find the query and follow up from there. I’m fond of using the “Tracked Queries” report in SSMS under Query Store, and that would show us the query and it’s recent plans.
Biggest CPU Improvements
Here’s the second example from the procedure’s comments.
		EXECUTE [dbo].[QueryVariation]
			@DatabaseName	= 'WideWorldImporters',
			--@ReportIndex		= '[dbo].[QueryVariationIndex]',
			--@ReportTable		= '[dbo].[QueryVariationReport]',
			@Measurement		= 'CPU',
			@Metric				= 'Total',
			@VariationType		= 'I',
			@ResultsRowCount	= 10,
			@MaxPlanCount		= 1,
			@IncludeQueryText	= 1;
I’ve added my database name and left the report tables in comments, and I did change the option to include query text.
This report should show us queries that have improved the most, based on total CPU usage. It will only give us 10 results, and only includes query with a single plan.
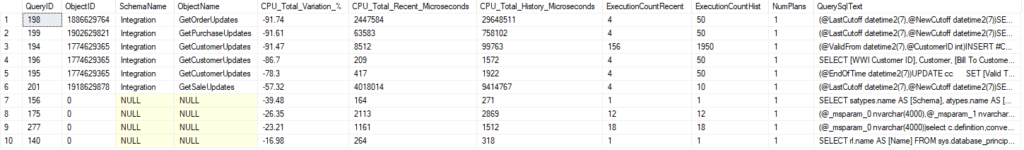
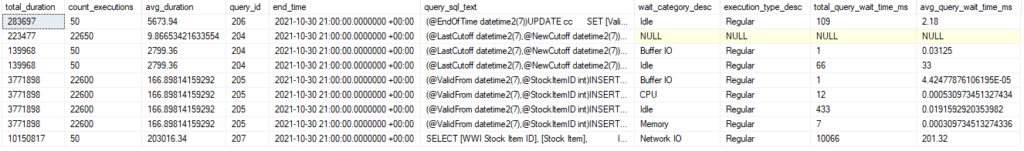
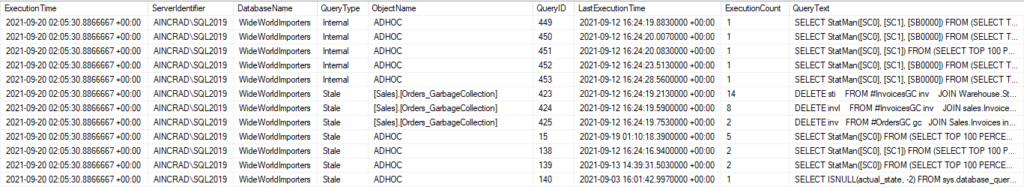
Results here are showing us procedure with the biggest reduction in overall CPU usage, and several are around 90%. But, that’s not surprising since we measured off the total numbers instead of average, and we’ve run the queries far less in the recent window. If we run the query 92% less in the recent window, this will show up as a reduction.
If our executions were more even, it could draw attention to statements that have improved despite the plan not changing, since we set our @MaxPlanCount to 1.
The QuerySQLText has information on variables at the beginning, but we see which statement is being referred to by each line of the report.
Query Variation Usage
The Query Variation report is good for a general comparison of performance. Run this daily, check your average duration\CPU\logical IO reads against the historical to look for regressions, and you get a good list of queries and procs you may want to look into.
Do keep in mind that you can’t use this check the results of a change to a query. If you are changing the text of a statement in any way, the modified statement is a different query_id in Query Store. So this report wouldn’t compare it to the original statement.
This can identify queries that have a change in performance because of a new plan, depending on how you set the @MaxPlanCount. So if you are changing an index to improve a query, a query variation report could show the statement’s improvement (or regression).
Speaking at SQL Friday this week
If you are not aware of SQL Friday, there’s a talk done online live every week at noon CET (GMT +6). You can also view previous sessions through links here.
I’ll be speaking this week with a case study on optimizing a very frequently run procedure. It is the same subject I presented at Virtual PASS 2021.
I have a few more blogs coming on the QDS Dashboard, and a few other topics I’m likely to write on soon. If you have any topics related to performance in SQL Server you would like to hear more about, please feel free to make a suggestion. You can follow me on twitter (@sqljared) and contact me if you have questions.