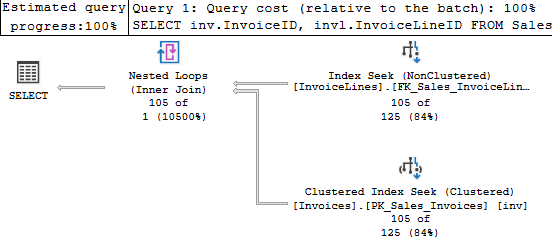
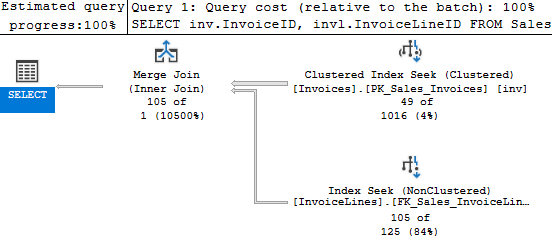
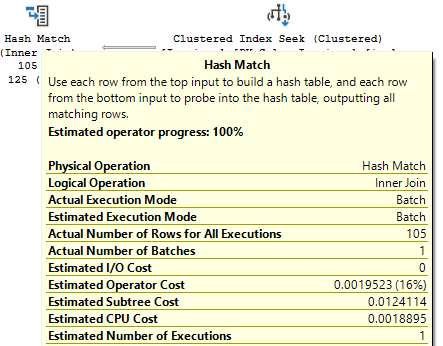
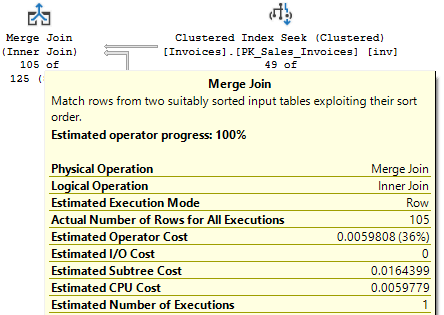
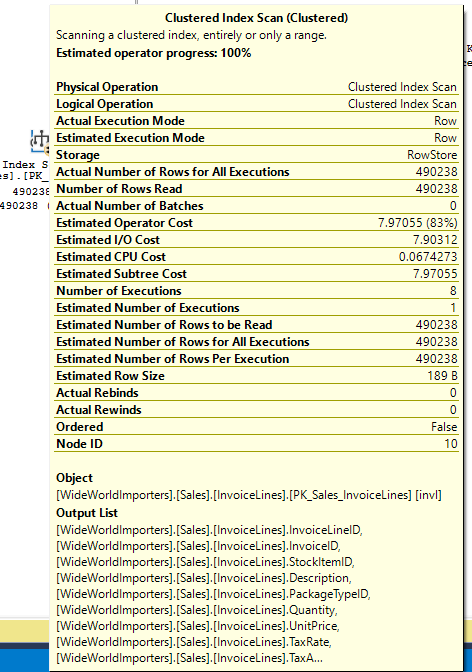
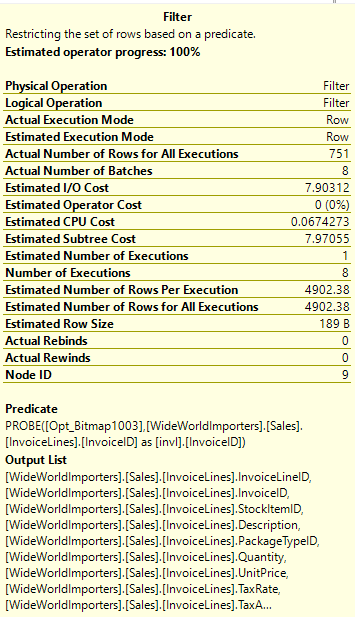
There are a lot of things to know to understand execution plans and how they operate. One of the essentials is understanding joins, so I wanted to post about each of them in turn.

The three basic types of join operators are hatch match, merge, and nested loops. In this post, I’m going to focus on the last, and I will post on the other two shortly.

How Nested Loops Operate

Nested loops joins are the join operator you are likely to see the most often. It tends to operate best on smaller data sets, especially when the first of the two tables being joined has a small data set.

In row mode, the first table returns rows one at a time to the join operator. The join operator then performs a seek\scan against the second table for each row passed in from the first table. It searches that table based on the data provided by the first table, and the columns defined in our ON or WHERE clauses.

  • You can’t search the second table independently; you have to have the data from the first table. This is very different for a merge join.
  • A merge join will independently seek or scan two tables, then joins those results. It is very efficient if the results are in the same order so they can be compared more easily.
  • A hash join will seek or scan the second table however it can, then probes the hash table with values from the second table based on the ON clause.

So, if the first table returns 1,000 rows, we won’t perform an index seek (or scan) against the second; we will perform 1,000 seeks (or scans) against that index, looking for any rows that relate to the row from the first table.

The query above joins several table, using nested loops between each. we can see that the row counts for the first several tables are all 1. We read one SalesPerson record, the related SalesTerritory, an Employee record, and a Person record. When we join that to the SalesOrderHeader table, we find 234 related rows. That comes from 1 index seek, as internal result set only had 1 row thus far. If we join to LineItem next, we would perform that seek 234 times.

Key Lookups

The optimizer always uses nested loops for key lookups, so you’ll see them frequently for this purpose. I was unsure if this was the only way key lookups are implemented, but this post from Erik Darling confirms it.

In the plan above, we return 149 rows from OrderLines table. We use a nested loops join operator so we can include the UnitPrice and Description in our output, since they aren’t in the nonclustered index.

Which means we execute the key lookup 149 times. The cost for this operator is 99% of the total query, but the optimizer overestimated how many rows we would return.

I frequently look at key lookups as an opportunity for tuning. If you look at the output for that operator, you can see which columns are causing the key lookup. You can either add those columns to the index you expect this query to use (as included columns), or you can ask whether those columns really need to be included in the query. Either approach will remove the key lookup and the nested loop.

LOOP JOIN hints

You can direct SQL Server to use nested loops specifically in your query by writing the query with (INNER\LEFT\RIGHT\FULL) LOOP JOIN. This has two effects:

  • Forces the optimizer to use the specified join type. This will only force the join type for that specific join.
  • Sets the join order. This forces the tables to be joined in the order they are written (subqueries from WHERE EXISTS clauses are excluded from this). So this point may affect how the others joins operate.

I’ve blogged about using hints previously, so I won’t go on for long on this subject. I like the phrase “With great power comes great responsibility” when thinking about using hints to get a specific behavior. It can be an effective way to get consistent behavior, but you can make things worse if you don’t test and follow up to confirm it works as intended.

Summary

I’ll discuss the other two join types in another post. In short, hash matches are more efficient for large data sets, but the presence of a large data set should make us ask other questions. Merge joins are very efficient when dealing with data from two sources that are already in the same order, which is unlikely in general.

Thanks to everyone who voted for my session in GroupBy. I enjoyed speaking at the event, and had some interesting discussion and questions. I expect recordings for the May event will be available on GroupBy’s Youtube page, so keep an eye out for that if you missed the event.

As always, I’m open to suggestions on topics for a blog, given that I blog mainly on performance topics. You can follow me on twitter (@sqljared) and contact me if you have questions. You can also subscribe on the right side of this page to get notified when I post.

Hope you are all enjoying a long weekend.

In my most recent blog post, I looked at the Query Variation report, which compares the recent performance of queries versus their historical performance to either highlight improvements or regressions in performance. The Waits Variation component does the same, but comparing the recent waits for a query to its historical waits.

One thing to keep in mind, is that if a given query is changed in any way (to change the filter, return additional columns, or include a hint), the changed query will have a different query_id in Query Store. In which case, both the Waits Variation and Query Variation procedures will not compare the historical performance of the old query to the recent performance of the new one.

That being said, let’s look at the dbo.WaitsVariation procedure’s options.

Waits Variation Options

  • @ServerIdentifier: Defaults to the current instance. Set this to gather data from another instance of SQL Server.
  • @DatabaseName: Defaults to the current database. I’m querying data from WideWorldImporters for my examples.
  • @ReportIndex: Default NULL. When used, stores information about the parameters used for the report.
  • @ReportTable: Default NULL. Allows you to store the report data in a table like dbo.WaitsVariationStore, created by the installer.
  • @WaitType: Which wait category are we concerned with? Total by default. [Total, CPU, Lock, Latch, BufferLatch, BufferIO, WorkerThread, NetworkIO, Parallelism…] There are 36 options here, so check the header of dbo.WaitsVariation for the full list.
  • @Metric: Do we want to compare the total wait time for the query, or the average? Avg by default. [Avg, Total]
  • @VariationType: Are we looking for queries that have improved [I] or regressed [R]. ‘R’ by default.
  • @ResultsRowCount: Number of rows to include in the report. Only the largest regressions or improvements are included. Default is 25, and if this value is NULL or negative, the procedure uses the default.
  • @RecentStartTime and @RecentEndTime: Defines what the ‘recent’ period is, which will be compared against the historical. The defaults are 1 hour ago for @RecentStartTime, and now for @RecentEndTime.
  • @HistoryStartTime and @HistoryEndTime: Defines what the ‘history’ period is, which will be compared against the recent. The defaults are 30 days ago for @HistoryStartTime, and 1 hour ago for @HistoryEndTime.
  • @IncludeQueryText: Includes the text for any identified queries in the output. Default is 0.
  • @ExcludeAdhoc: Ignores ad hoc queries, anything that isn’t part of a procedure or other defined object. Default is 0.
  • @ExcludeInternal: Excludes internal queries\operations run by SQL Server itself. Default is 0.
  • @VerboseMode: Default 0. Provides the queries being used in the messages tab.
  • @TestMode: Default 0. When enabled, does everything except actually run the generated queries to create the report.
  • OUTPUT @ReportID: When you @ReportIndex and @ReportTable, a saved report is generated. You can then use the @ReportID to see that report separately.

So, these parameters are very similar to dbo.QueryVariation. You’ll likely want to alter your time parameters, and you could generate multiple reports to check different wait types. Or you could do a regular report for total waits, and review to see which type of wait had the biggest change.

Best Total Wait Improvement

Given that the default is to look for regressions instead of improvements, if I wanted to compare the last two day’s waits to the previous month, I could use the following:

DECLARE @RecentStartTime	DATETIME2 = DATEADD(HOUR, -48, GETUTCDATE());
DECLARE @RecentEndTime	DATETIME2 = GETUTCDATE();
DECLARE @HistoryStartTime	DATETIME2 = DATEADD(DAY, -30, @RecentEndTime);
DECLARE @HistoryEndTime	DATETIME2 = @RecentStartTime;

	EXECUTE [dbo].[WaitsVariation]
		@DatabaseName	= 'WideWorldImporters',
		@WaitType	= 'Total',
		@Metric		= 'Avg',
		@VariationType = 'I',
		@ExcludeAdhoc = 1,
		@HistoryStartTime = @HistoryStartTime,
		@HistoryEndTime	= @HistoryEndTime,
		@RecentStartTime = @RecentStartTime,
		@RecentEndTime = @RecentEndTime;

Choosing ‘Total’ as your @Metric may work for some cases, but would tend to give results with large variation. If a query executed more times in one period than the other, I would expect that period to have more waits.

I ran a workload to generate some activity, and only one query in it regressed, so I’m returning improvements so there’s a little more to look at.

Wait Variation – Improvements

So, the four procs listed had some rather dramatic improvements. We can see the amount of the total wait reduction, and columns for unknown and CPU waits. This is only a portion of the incredibly wide result set. There are history, recent, and variation % columns for each wait type.

We ran this script looking for ‘Total’ as our @WaitType, which means we are sorting and returning the top rows with the most improvement in that area. But it did record the improvement for all wait types. It only takes a little scrolling to find our causes:

Wait Variation – Causes

So, the first procedure had relatively large parallelism waits in its history, compared with none in the recent period. I would argue the variation % should be 100% not 0%, but the logic here may be special to prevent us from diving by 0.

All four procedures had NetworkIO waits. It’s likely the tool I was using to run these queries in a loop was not consuming the results fast enough, causing delays within SQL Server. These queries were taking so long that I used a smaller date range on my more recent calls. Fewer records, less time for the app to consume them, and smaller NetworkIO waits.

One thing I have noticed is that if you use @IncludeQueryText, the text returned is compressed and unreadable. Unless you create a saved report by using the @ReportIndex and @ReportTable options, which leads us to the second procedure.

Waits Variation from Store

If I save the results, there are records in the tables indicated, I can run dbo.WaitsVariationFromStore to read out the header of the report and its details in two result sets.

Waits Variation from Store output

The result set is much more limited, but focuses on the metric we chose. We can see the number of executions, the related object, the change in our totals waits, and the decompressed text for the query itself.

There are only three parameters for this proc, but here’s an example:

USE QDSToolBox
GO

	EXECUTE dbo.WaitsVariationFromStore
		@ReportID = 1,
		@VerboseMode = 0,
		@TestMode = 0;

Nearly done

There are two more components to the QDS Dashboard I want to detail, but I may be spreading them out between some other topics I want to blog on.

Time to go update slides for a user group meeting later this week.

If you have any topics related to performance in SQL Server you would like to hear more about, please feel free to make a suggestion. You can follow me on twitter (@sqljared) and contact me if you have questions.

In a recent talk with the Sacramento SQL Server User Group (@SACSQLUG), a question was asked I wanted to address, and the answer seemed more like a short blog than a tweet.

I was presenting on how to use the TOP clause to break down large operations into short, fast, bite-sized operations. The mechanics are things I learned from writing processes that do garbage collection, backfill new columns, and anonymizing PII data on existing tables. I’ve just posted the slides and example scripts here if you are interested.

Are they the same?

The question was whether the SET ROWCOUNT command would work just the same, and the answer is sometimes yes but largely no.

SET ROWCOUNT will limit the number of rows returned by the following statements, and this functions like a connection level setting. It will remain in effect until you change it or clear it by setting the rowcount to 0 (unlimited).

I would be concerned about setting the option and not clearing it, causing it to affect additional statements.

So let’s adapt some of my examples and see how it behaves.

The simple case with SET ROWCOUNT

Here’s a script to return 100 rows from a table in WideWorldImporters.

USE WideWorldImporters
GO
SELECT TOP 100 
	sol.OrderLineID, 
	sol.UnitPrice 
FROM Sales.OrderLines sol 
WHERE sol.OrderLineID < 1000 
	AND sol.UnitPrice > 50;
GO

SET ROWCOUNT 100;

SELECT 
	sol.OrderLineID, 
	sol.UnitPrice 
FROM Sales.OrderLines sol 
WHERE sol.OrderLineID < 1000 
	AND sol.UnitPrice > 50;
GO

Fairly simple, and the plans are much the same.

100 rows, as promised

The only difference is that the TOP operator is missing. But the query is behaving much like it is present. I surmise that the SELECT operator itself is limiting the number of rows by not requesting additional data after the first 100.

Quick aside on Row Mode

SQL Server queries typically operate in row mode. Batch mode is used in some cases with columnstore indexes and can be used on rowstore indexes in SQL Server 2019 and above. But I want to focus on how a query processes in row mode (with thanks to Grant Fritchey for his description of this).

The activity is driven by the root node, in this latest plan the Select operator. It asks the operator under it (the Top operator) to go get a row. The Select operator doesn’t really care how that operator does what it does, it just wants a row. And for the Top operator to do it’s job, it asks the operator below it for the same.

Until we get down to the last Nested Loops operator. It asks the Index Scan operator for a row, and that operator can finally get us some data. It returns a row and, being a join operator, Nested Loops asks the Key Lookup for data related to its row. It joins the results and pass the joined row up to the operator above it.

When data flows up to an operator, it will typically reply, “Now give me another row.”

The Top operator changes this be simply not asking for more rows once it has received the number of rows it needs. So all the activity for the underlying operators stops because the Top hasn’t told it to continue.

In the simple example of my two queries, we can see the Clustered Index Seek only returned 100 rows, then the query ended. It seems with SET ROWCOUNT in effect, the Select operator itself stopped the operation by not requesting more data.

But then it falls apart

Here’s a stored procedure I wrote to delete old records from the Sales.Orders table and all related tables.

USE WideWorldImporters
GO
CREATE OR ALTER PROCEDURE Sales.Orders_GarbageCollection(
@BatchSize INT = 100,
@Duration INT = 30
)AS
SET NOCOUNT ON;

	DECLARE 
		@NestedTransaction BIT = 0,
		@EndTime DATETIME;

	CREATE TABLE #OrdersGC(
		OrderID INT,
		INDEX IX_OrdersGC(OrderID)
	);

	CREATE TABLE #InvoicesGC(
		InvoiceID INT,
		INDEX IX_InvoicesGC(InvoiceID)
	);

	SET @EndTime = DATEADD(SECOND, @Duration, GETUTCDATE());

	WHILE (GETUTCDATE() < @EndTime)
	BEGIN
		TRUNCATE TABLE #OrdersGC;
		TRUNCATE TABLE #InvoicesGC;

		IF @@NESTLEVEL > 0
		BEGIN
			SET @NestedTransaction = 1;
		END
		ELSE
		BEGIN
			BEGIN TRANSACTION;
		END;

		INSERT INTO #OrdersGC
		SELECT TOP (@BatchSize)
			so.OrderID
		FROM Sales.Orders so
		WHERE
			so.OrderDate < 
				DATEADD(month, -50, GETUTCDATE());

		DELETE sol
		FROM #OrdersGC gc
		JOIN Sales.OrderLines sol
			ON sol.OrderID = gc.OrderID;
	
		INSERT INTO #InvoicesGC
		SELECT --TOP (@BatchSize)
			inv.InvoiceID
		FROM #OrdersGC gc
		JOIN Sales.Invoices inv
			ON inv.OrderID = gc.OrderID;


			DELETE ctr
			FROM #InvoicesGC inv
			JOIN Sales.CustomerTransactions ctr
				ON ctr.InvoiceID = inv.InvoiceID;

			DELETE sti
			FROM #InvoicesGC inv
			JOIN Warehouse.StockItemTransactions sti
				ON sti.InvoiceID = inv.InvoiceID;

			DELETE invl
			FROM #InvoicesGC inv
			JOIN sales.InvoiceLines invl
				ON invl.InvoiceID = inv.InvoiceID;

		DELETE inv
		FROM #OrdersGC gc
		JOIN Sales.Invoices inv
			ON inv.OrderID = gc.OrderID;

		DELETE so
		FROM #OrdersGC gc
		JOIN Sales.Orders so
			ON so.OrderID = gc.OrderID;
		
		IF @NestedTransaction = 0
		BEGIN
			COMMIT TRANSACTION;
		END;

	END;

GO

BEGIN TRANSACTION

EXEC Sales.Orders_GarbageCollection
	@BatchSize = 100,
	@Duration = 5;

ROLLBACK TRANSACTION
GO


--CREATE INDEX IX_Sales_Orders_OrderDate ON Sales.Orders (OrderDate);

This proc identifies 100 rows in Sales.Orders that we want to delete, and puts those OrderIDs in a temp table. We then delete records from related tables based on those OrderIDs, and we similarly delete records related to rows we want to delete from Sales.Invoices. And this procedure was written to loop and keep deleting records for a specified number of seconds.

One key thing to remember is that we only use a TOP clause when we populate the first temp table. We want to delete those 100 rows and everything related to them, not those 100 rows and only 100 related rows from the related tables. If we only delete some of the related rows, our process will fail on a foreign key violation when we try to delete some rows from the Sales.Orders table.

If you were to change this to use a SET ROWCOUNT, you would need to reset that to 0 after the statement inserting into the temp table. If not, the next statement looks like this:

With SET ROWCOUNT 100

Note the Top operator in this DELETE statement. All is flowing as expected, but then the Top operator shuts this down prematurely. Top only passes on 100 rows, when then get deleted. So, later when we try to DELETE from the Sales.Orders table, we fail because we haven’t deleted all the related rows.

And you could just SET ROWCOUNT 0 once you don’t need it, but I’d be concerned I’d forget to do so and cause issues.

Also, it’s deprecated

If you take a look at the remarks section of the documentation for this statement, there’s something interesting.

Using SET ROWCOUNT will not affect DELETE, INSERT, and UPDATE statements in a future release of SQL Server. Avoid using SET ROWCOUNT with DELETE, INSERT, and UPDATE statements in new development work, and plan to modify applications that currently use it. For a similar behavior, use the TOP syntax. For more information, see TOP (Transact-SQL).

Microsoft

So they aren’t using the word deprecated here, but it amounts to that. This will stop affecting DELETE, INSERT, and UPDATE statements in future, so you wouldn’t want to write a process using SET ROWCOUNT only to have it fail at some undefined point in the future.

It doesn’t state whether this will also affect MERGE statements, but I’d rather not have to use different syntax on some statements anyway, so I’ll just stick with my TOP clauses.

Happy Holidays

Should have another post or two coming in the next few weeks thanks to some extra time off and not traveling much for the holidays. Hope yours are great.

If you have any topics related to performance in SQL Server you would like to hear more about, please feel free to make a suggestion. You can follow me on twitter (@sqljared) and contact me if you have questions.

Also, subscribe to get emails when I post again.