Estimates and statistics are often discussed in our community, but I doubt the average DBA knows how they flow. So I wanted to write a post with examples showing how SQL Server estimates the rows for a specific operation.

Statistics

The SQL Server optimizer will estimate how many rows it expects to return for a query using statistics. This is part of how it determines the cost of plans and decides which plan to use.

Let’s take a look at the statistics for the Sales.Order table in the WideWorldImporters database. There is an index on the CustomerID column, so we’ll look at the statistics for that object.

DBCC SHOW_STATISTICS('Sales.Orders', FK_Sales_Orders_CustomerID);

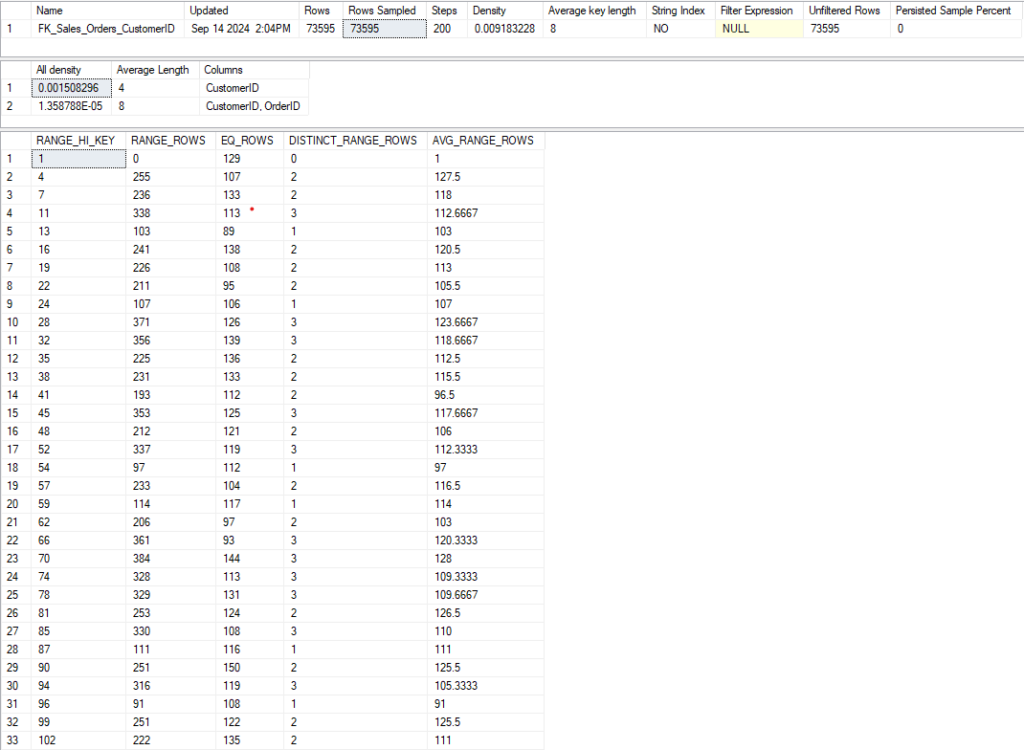
Here’s most of the result from the DBCC command:
You can also get the same information by double-clicking the statistic in SSMS, and going to Detail on the popup:
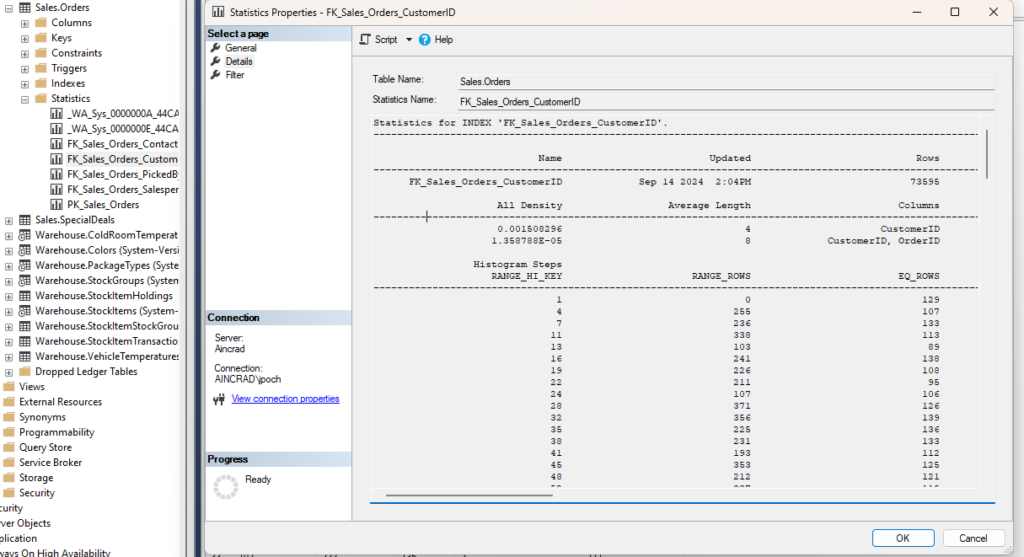
Let’s look at the most important elements.

  • Updated: Very important. How often you should update statistics depends on several factors, but it’s good to know how old your statistics are when troubleshooting a bad plan. This date is from 2016 if you’ve just restored the WideWorldImporters database, but I just rebuilt that index (which updates the stats with a 100% sampling rate for free).
  • Rows and Rows Sampled: How many rows are in the index, and how many were sampled for the statistic object. This is a 100% sampling rate, but when stats are updated automatically this number can easily be less than 1%. The lower the sampling rate, the less accurate the statistics will be. This can lead to bad decisions by the optimizer. I prefer a higher rate, but we have to decide how long we want this to take on a large table.
  • Steps: Each step contains information about a range of key values for the index. Each step is defined by the last range value included. The final output shows each step as a row. 200 is the maximum number of steps.
  • All Density: This number is the inversion of the number of unique values for this column (1/distinct values). If the key has multiple columns, this will have multiple rows, and you can see how much more selective the index is when the additional columns are included. The value of 0.001508296 corresponds to 663 unique CustomerID values in the index. There are multiple rows in the second result set because this index has multiple columns. The All Density value gives the uniqueness for each combination of columns.

The third result set is a bit more involved, so I wanted to discuss how we can use it.

Histogram

  • RANGE_HI_KEY: Indicates the highest value for this range of values, as each row represents a step I referenced earlier. There is a row with a RANGE_HI_KEY of 3, and the next row is 6. This means CustomerID 4 and 5 are in the same step as 6, which is the RANGE_HI_KEY.
  • RANGE_ROWS: Gives the number of rows for all values of this step\range, excluding the RANGE_HI_KEY.
  • EQ_ROWS: Gives the number of rows equal to the RANGE_HI_KEY.
  • DISTINCT_RANGE_ROWS: This gives how many distinct values there are in the RANGE_ROWS, excluding the RANGE_HI_KEY again.
  • AVG_RANGE_ROWS: How many values are there for a key value in this range, on average.

Looking at the third row where the RANGE_HI_KEY is 6, the EQ_ROWS are 106. So if we query for CustomerID = 6, this histogram tells us we should return 106 rows.

The DISTINCT_RANGE_ROWS is 2, so there is only one more CustomerID in this range (either 4 or 5). RANGE_ROWS is 214, so the other CustomerID should have 108 rows, but if there are more than 2 distinct values we won’t know any number besides the EQ_ROWS. So if we look up a range value that isn’t the RANGE_HI_KEY, we’ll estimate based on AVG_RANGE_ROWS.

Example #1: RANGE_HI_KEY

To see how these numbers are used, let’s look at a simple query against the Sales.Orders table.

--RANGE_HI_KEY and EQ_ROWS
SELECT 
	OrderID
FROM Sales.Orders so
WHERE
	so.CustomerID = 99;
GO

Since 99 is the RANGE_HI_KEY for its step, we just need to check the EQ_ROWS. This query should return 122 rows. Since 99 is the RANGE_HI_KEY for its step, we just need to check the EQ_ROWS. This query should return 122 rows.

So let’s look at the plan to confirm.
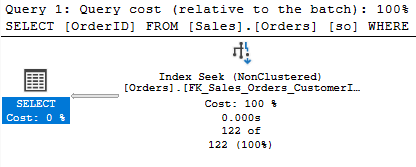
That’s the estimate the plan displays, and it’s accurate because I just updated my stats.

Example #2: AVG_RANGE_ROWS

Slightly different if we search for a value that is not the RANGE_HI_KEY for its step.

--RANGE_HI_KEY and AVG_RANGE_ROWS
SELECT 
	OrderID
FROM Sales.Orders so
WHERE
	so.CustomerID = 98;
GO

Each step is defined by its highest value. So if there is a step for 96 and 99, 98 is in the same step as 99. We don’t know the number of rows for any row in the step except for the RANGE_HI_KEY, so the estimate should be the value stored in AVG_RANGE_ROWS, 125.5.
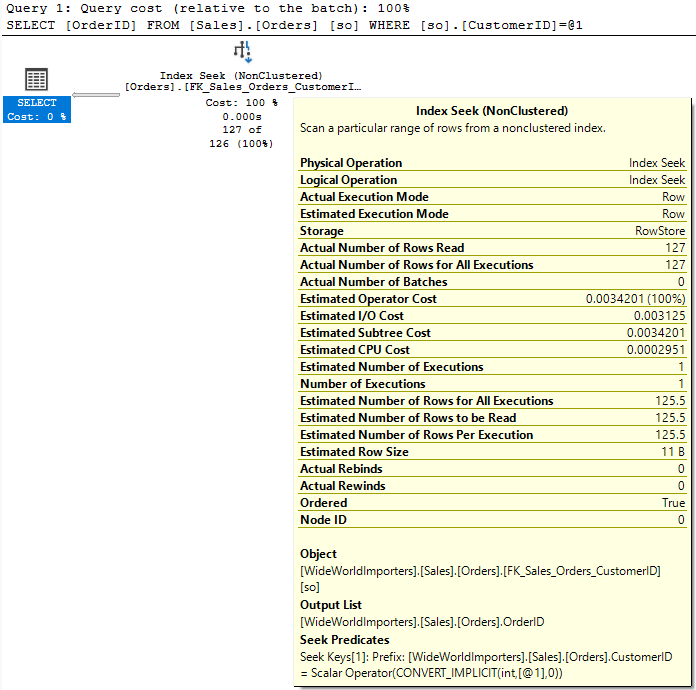
The operator indicates an estimate of 126, but if we hover over it we can see the exact value of 125.5. We returned 127 rows. There are limitations here, but this is a pretty close estimate.

Exampled #3: Variables

We see a different behavior if we use a variable in the query.

--Variable Estimate
DECLARE @CustomerID INT = 99;

SELECT 
	OrderID
FROM Sales.Orders so
WHERE
	so.CustomerID = @CustomerID;
GO
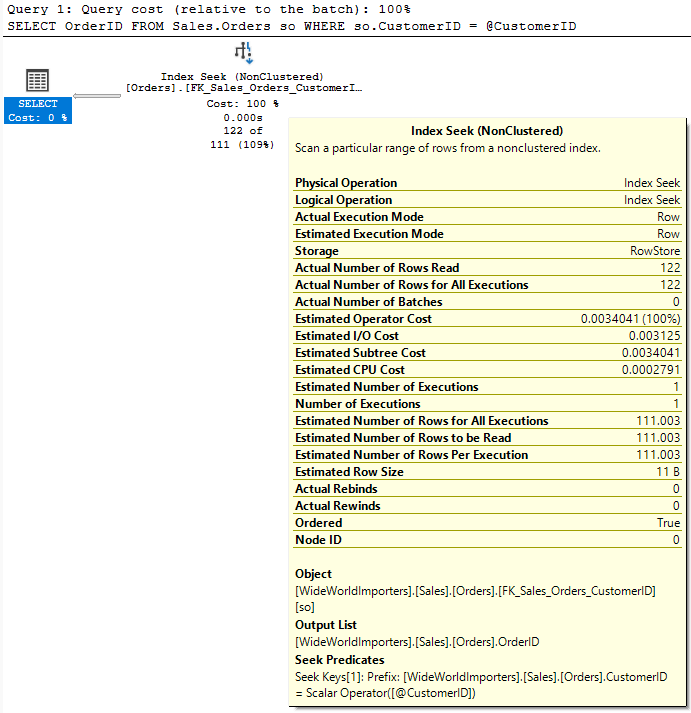
The estimate is off. When we had the value inline, the optimizer “sniffed” that value to see how many rows to expect. It didn’t do the same for the local variable.

Since the optimizer doesn’t know what the value inside that variable is, it can’t use the histogram. It has to make an estimate based on the details at the table level instead of the step level.

I mentioned the All Density value earlier. It’s a measure of how unique a given column is. If you multiply that value by the number of rows in the table, you should get an average number of rows that would be returned for a given CustomerID.

--Calculated Estimate
DECLARE
	@density numeric(12,12) = 0.009183228,
	@all_density numeric (12,12) = 0.001508296,
	@rows int = 73595.

SELECT
	1.0/@all_density AS Distinct_CustomerID,
	@all_density * @rows AS Estimated_Rows;
GO

This matches the value of 111.003 from the execution plan. So this is a somewhat blind estimate for any CustomerID when the optimizer doesn’t know the value before compiling.

Sidenote on Example #3:

This didn’t calculate correctly for me at first. It caused much consternation as I did more reading to try to understand why the numbers didn’t match. I likely would have posted this blog some time ago without this issue.

Then I realized WideWorldImporters was created for SQL Server 2016. These statistics were created in SQL Server 2016, and were restored with the rest of the database on my instance of SQL Server 2022.

Maybe I should rebuild the index? Then I did. And now it works perfectly.

Something to keep in mind for your endeavors.

Exampled #4: RECOMPILE

If we add OPTION(RECOMPILE) to our query, the optimizer will sniff the local variable and

--Recompile to Sniff Local Variable
DECLARE @CustomerID INT = 99;

SELECT 
	OrderID
FROM Sales.Orders so
WHERE
	so.CustomerID = @CustomerID
OPTION(RECOMPILE);
GO

And now our estimate is accurate again. It’s good to understand this point because you may see a large difference if you use OPTION(RECOMPILE) with a query that depends on a local variable.

Range Estimates

With range seeks (inequality comparisons), things are a bit different. We’re not looking for a specific value, and we’ll use our statistics differently. And there is one issue I’d like to point out. Consider this query:

SELECT so.OrderID
FROM Sales.Orders so
WHERE
	so.CustomerID >= 1001;
GO

When I execute this, the estimate is very accurate.

We’re only off by 1 row, and I will happily accept. But how did the optimizer arrive here? Let’s look at the last group of steps in this statistic.
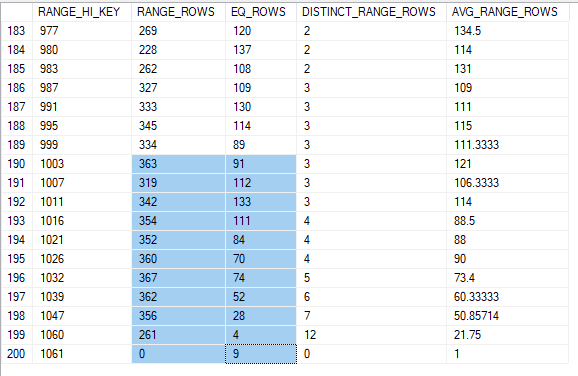
The RANGE_ROWS is useful to use here for this range seek. It will tell the optimizer how many rows to expect from each step, but it excludes the EQ_ROWS, which is the number of rows for the RANGE_HI_KEY itself. So, to estimate this we will need to include the EQ_ROWS and RANGE_ROWS for each of these steps. If you add the highlighted numbers, you’ll end up with 4204.

Of course, the query would exclude CustomerID 1000, which should be in the step for CustomerID 1003. We don’t the exact value for this CustomerID; it’s one of our range values. So our best estimate is the AVG_RANGE_ROWS for that step, 121. If we subtract the 121 rows we estimate for CustomerID 1000, we have a final estimate of 4083.

Inequalities and Variables

But what if you used a variable with that same query?

DECLARE @CustomerID INT = 1001;

SELECT so.OrderID
FROM Sales.Orders so
WHERE
	so.CustomerID >= @CustomerID;
GO

The estimate is off by 82%. What just happened?

The optimizer can’t probe the variable, so it has nothing to base its estimate on. This estimate of 22078 is a default the optimizer uses guessing our query will return 30% of the rows in the table. This is present in the legacy cardinality estimator and the current CE for SQL Server 2022.

The first time I heard of this estimate was at a talk at PASS Summit. There are some references to it on other blogs, but there aren’t many of them.

These two blogs by Erik Darling and Andrew Pruski refer to the 30% estimate, and if you are reading this blog you might find them enlightening.

This blog by @sqlscotsman has more details about estimates and guesses involving other operators including LIKEs and BETWEENs.

In a more complex query where the range seek isn’t the only option to filter on, SQL Server can use other fields to make a more accurate estimate.

In Summary

Why does accuracy matter? When estimates are inaccurate, SQL Server will compare plans with incorrect costs. We’re more likely to end up with bad plans that over\under allocate resources or use the wrong join type or join order for a query.

The wrong plan can multiply the runtime of a query many times and massive increase blocking issues.

Knowing how our statistics function can help us write better procedures that are less likely to leave the optimizer in the dark.

My social media links are above. Please contact me if you have questions, and I’m happy to consult with you if you have a more complex performance issue. Also, let me know if you have any suggestions for a topic for a new blog post.

Tempdb contention has long been an issue in SQL Server, and there are many blogs on the issue already. But I wanted to add one more mainly to highlight the improvements in recent versions of SQL Server

Tempdb contention is most often discussed in as relating to the creation of temp tables (and other objects) in tempdb. If you are experiencing this you will see PAGELATCH_EX or PAGELATCH_SH waits, frequently with wait resources like 2:1:1 or 2:1:3. This indicates contention in database 2 (tempdb), page 1 (the first data file in tempdb), and one of the PFS, GAM, or SGAM pages (which are pages 1, 2, and 3 respectively). Tempdb files of sufficient size will have additional PFS, GAM, and SGAM pages at higher page numbers, but 1 and 3 are the pages most often referenced.

Temp tables aren’t the only objects being created in tempdb. Table variables are as well unless they are memory-optimized. There are also worktables for sorts, spools, and cursors. Hash operations can spill to disk and are written into tempdb. Row versions are written into tempdb for things like read committed snapshot isolation, and triggers make use of row versioning as well. For more details, check out this excellent post by David Pless.

Before recent releases, there were three main suggestions for reducing tempdb contention.

  • Trace flags (1118 and 1117)
  • More tempdb files
  • Create fewer objects in tempdb

Honestly, I don’t think the third was even included in a lot of the blogs on the subject, and it is very important. Many of the actions that use tempdb can’t be avoided, but I tend to use memory-optimized table variables instead of temp tables the vast majority of the time.

In one case a few years ago, I replaced the memory-optimized table variables in one very frequently executed stored procedure with temp tables to see if using temp tables would result in better execution plans. This procedure was executed about 300 million times per day across several SQL Server instances using similar databases, and the procedure used 4 temp tables. The plans didn’t matter; creating 1.2 billion more temp tables per day added far too much tempdb contention.

But the main point of this post is to help everyone catch up on the topic, and see how more recent versions of SQL Server improve on this issue.

Improvements in SQL Server 2016

SQL Server 2016 introduced several improvements that help reduce tempdb contention.

The most obvious is that setup will create multiple files by default, one per logical server up to eight. That bakes in one of the main recommendations for reducing tempdb contention, so it’s a welcome improvement.

There are also behavior changes that include the behavior of trace flags 1117 and 1118. All tempdb data files grow at the same time and by the same amount by default, which removes the need for trace flag 1117. And all tempdb allocations use uniform extents instead of mixed extents, removing the need for trace flag 1118.

So, that’s another recommendation for reducing tempdb contention already in place.

Several other changes also improve caching (reducing page latch and metadata contention), reduce the logging for tempdb operation, and reduce the usage of update locks.
For the full list, check here.

Improvements in SQL Server 2019

The big change here is the introduction of memory-optimized tempdb metadata. The documentation here says that this change (which is not enabled by default, you will need to run an ALTER SERVER CONFIGURATION statement and restart) “effectively removes” the bottleneck from tempdb metadata contention.

However, this post by Marisa Mathews indicates the memory-optimized tempdb metadata improvement in SQL Server 2019 removed most contention in PFS pages caused by concurrent updates. This is done by allowing the updates to occur with a shared latch (see the “Concurrent PFS updates” entry here).

Tempdb contention seen in sp_WhoIsActive output

One thing I would point out is that the metadata is being optimized here; the temp tables you create are not memory-optimized and will still be written to the storage under tempdb as usual.

Improvements in SQL Server 2022

The post above also indicates that SQL Server 2022 reduces contention in the GAM and SGAM pages by allowing these pages to be updated with a shared lock rather than an update log.

The issue with the PFS, GAM, and SGAM pages has always been the need for an exclusive latch on those pages when an allocation takes place. If 20 threads are trying to create a temp table, 19 of them get to wait. The suggestion to add more data files to tempdb was a way to get around access to these pages being serialized; adding more files gives you more of these pages to spread the allocation operations across.

In Summary

The gist is that tempdb contention has been nearly eliminated in SQL Server 2022. There are still several other actions that use tempdb, and you may see contention if have a niche workload or use a lot of worktables.

Hopefully, this post will help you decide if it’s time for an upgrade. If you have been seeing tempdb contention on these common pages, the latest release should be a major improvement.

Feel free to contact me with any questions or let me know of any suggestions you may have for a post.

Wanted to point out a few more good articles and a video on the subject that you may enjoy.

I’ve discussed the other two join types, so what is the niche for the third?

Before we get into how it works and what my experience is I want to mention a response to my last blog, because it leads into our topic.

Addendum on Hash Match Joins

My last blog post was on hash match joins, and Kevin Feasel had a response on his blog.

Hash matches aren’t inefficient; they are the best way to join large result sets together. The caveat is that you have a large result set, and that itself may not be optimal. Should it be returning this many rows? Have you included all the filters you can? Are you returning columns you don’t need?

Jared Poche

I might throw in one caveat about hash match joins and being the best performers for two really large datasets joining together: merge join can be more efficient so long as both sets are guaranteed to be ordered in the same way without an explicit sort operator. That last clause is usually the kicker.

Kevin Feasel, Curated SQL

And he is quite correct. Nested loops perform better than hash match with smaller result sets, and hash match performs better on large result sets.

Merge joins should be more efficient than both when the two sources are sorted in the same order. So merge joins can be great, but the caveat is that you will rarely have two sources that are already sorted in the same order. So if you were looking for the tldr version of this blog, this paragraph is it.

How Merge Joins Operate

Merge joins traverse both inputs once, advancing a row at a time and comparing the values from each input. Since they are in the same order, this is very efficient. We don’t have to pay the cost to create a hash table, and we don’t have the much larger number of index seeks nested loops would encounter.

The process flows like this:

  1. Compare the current values from each data source.
  2. If they match, add the joined row to the result set, and get the next value from both sources.
  3. If not, get the next row from the data source with the lower sorted value.
  4. If there are no more rows from either source, the operation ends.
  5. Otherwise, return to step 1 with the new input.

At this point, I would create a great visual for this, but one already exists. So let me refer you a post by Bert Wagner. The video has a great visualization of the process

Input Independence

I find nested loops is probably the easiest join to understand, so I want to draw a distinction here. Using nested loops, we would get a row from the first source then seek the index against the second to get all rows related to the row from the first source. So, our ability to seek from the second depends on the first.

A merge join seeks from both independently, taking in rows and comparing them in order. So in addition to the requirement (with exception) that the sources have to be in the same order, we need a filter we can use for each source. The ON clause does not give us the filter for the second table, we need something else.

Here’s an example query and plan:

USE WideWorldImporters
GO
SELECT 
	inv.InvoiceID,
	invl.InvoiceLineID
FROM Sales.Invoices inv
INNER JOIN Sales.InvoiceLines invl
	ON invl.InvoiceID = inv.InvoiceID
WHERE
	inv.InvoiceID < 50;
GO

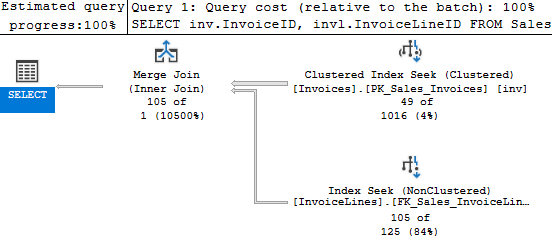
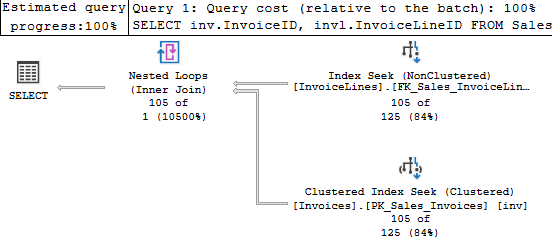
Both Invoices and InvoiceLines have indexes based on InvoiceID, so the data should already be in order. So this should be a good case for a merge (the nested loops below is because of the key lookup on InvoiceLines). But SQL Server’s optimizer still chose nested loops for this query.

I can hint it to get the behavior I expected, and that plan is below.

The estimates are way off for the Invoices table, which is odd considering we are seeking on the primary key’s only column; one would expect that estimate to be more accurate. But this estimate causes the cost for the seek against Invoices to be more expensive, so the optimizer chose the other plan. It makes sense.

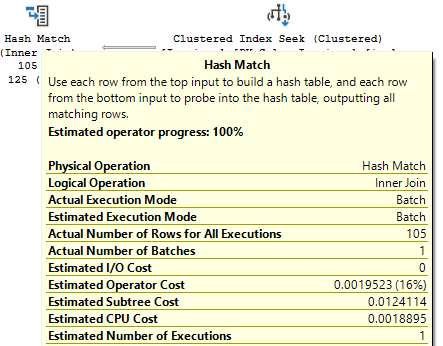
I updated the statistics, and a different plan was chosen. One with a hash match.

???

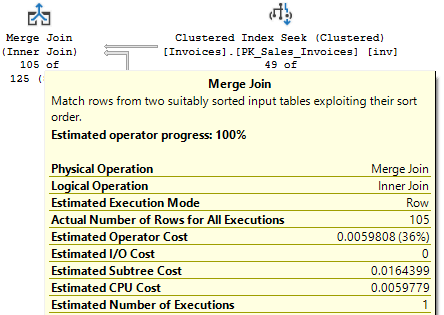
In that case, the difference in cost was directly the cost of the join operator itself; the cost of the merge join operator was 3x the cost of the hash match operator.

Even if the merge is more efficient, it seems it’s being estimated as being more costly, and specifically for CPU cost. You’re likely to see merge joins much less often than the other two types because of the sort requirement; how it is estimated may also be a factor.

About that sort

The first several times I saw a merge join in an execution plan, the merge was basically the problem with the query. It gave me the impression at the time that merge joins aren’t great in general. But in those cases, the execution plan had a sort after one of the index operations and before the join. Sure, the merge join requires that the two sources be sorted in the same order, but SQL Server could always use a sort operator (expensive as they are) to make that an option.

This seems like an odd choice to make, so let’s consider the following query:

USE WideWorldImporters
GO
SELECT *
FROM Sales.Invoices inv
INNER JOIN Sales.InvoiceLines invl
	ON invl.InvoiceID = inv.InvoiceID
WHERE
	inv.InvoiceDate < DATEADD(month, -12, getutcdate());
GO

So, this query does a merge join between the two, but there is a sort on the second input. We scan the index, then sort the data to match the other import before we perform the actual join. A sort operator is going to be a large cost to add into our execution plan, so why did the optimizer choose this plan?

This is a bad query, and the optimizer is trying to create a good plan for it. This may explain many other situations where I have seen a sorted merge. The query is joining the two tables on InvoiceID, and the only filter is on Invoices.InvoiceDate. There is no index on Invoices.InvoiceDate, so it’s a given we’ll scan that table.

If this query used nested loops, we could use the InvoiceID for each record from Invoices to seek a useful index against InvoiceLines, but that would mean we perform 151,578 seeks against that table.

A merge join, even if we have to sort the results from the table, would allow us to perform one index operation instead. But a merge join has to seek independently from the other source, and no other filter is available. So we perform an index scan against the second table as well.

This is probably the best among poor options. To really improve this query, you’d need to add an index or change the WHERE clause.

It took some time for me to realize why I most often saw merge joins in poor execution plans; I wasn’t seeing all the plans using them that perform well. If you are troubleshooting a high CPU situation, when you find the cause you’ll likely be looking at bad plan. We don’t tend to look for the best performing query on the server, do we?

So, if merge join is more efficient than the other two join types in general, we are less likely to be looking at queries where it is being used effectively.

Summary

Hopefully I’ll be getting back to a more regular schedule for the blog. There’s been a number of distractions (an estate sale, mice, etc), but life has been more calm of late (mercifully).

I spoke at the two PASS Summit virtual events over the last two years, and this year I am happy to be presenting in person at PASS Data Community SUMMIT for the first time. So if you are interested in how you can use memory-optimized table variables to improve performance on your system, look out for that session.