In contrast to the previous QDS Toolbox components, this one is relatively simple. Instead of a tool that’s ready to be scheduled to give you a report, this just adds the dbo.query_store_wait_stats_pivoted view.
So, what’s the value here?
The typical case
The way I use Query Store most often, is to investigate the performance of a specific procedure or statement. I tend to do this when I know there is an issue, or when I want to evaluate the improvement of a new change.
Here’s a query I’ll often run (or some variation thereof):
--Statement numbers for the last two hours, no aggregation
SELECT
	qrs.avg_duration * qrs.count_executions AS total_duration,
	qrs.count_executions,
	qrs.avg_duration,
	qsq.query_id,
	qsi.end_time,
	qt.query_sql_text,
	qsq.query_hash
FROM sys.query_store_query qsq
JOIN sys.query_store_query_text qt
	ON qt.query_text_id = qsq.query_text_id
JOIN sys.query_store_plan qp
	ON qp.query_id = qsq.query_id
JOIN sys.query_store_runtime_stats qrs
	ON qp.plan_id = qrs.plan_id
JOIN sys.query_store_runtime_stats_interval qsi
	ON qsi.runtime_stats_interval_id = qrs.runtime_stats_interval_id
WHERE
	qsq.object_id = OBJECT_ID('Integration.GetStockItemUpdates')
	AND qsi.end_time > DATEADD(hour, -2, GETUTCDATE())
	--AND qt.query_sql_text LIKE '%something%'
ORDER BY
	qt.query_sql_text,
	qsq.query_id,
	qsi.end_time
Now, Query Store’s performance statistics are separated into intervals. We can set the size for an interval when we turn on Query Store (60 minutes by default, I have it at 15 on my test environment). So, this query will show me the performance of each statement for each interval over the last two hours.
Sometimes I’ll aggregate the data so I can look at the averages over several days, but sometimes I like seeing each interval to see if there is a lot of variation.
So, here’s that result set:
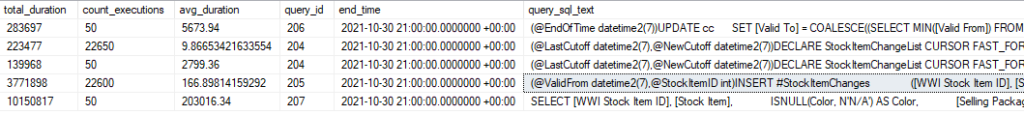
sys.query_store_wait_stats
But let’s say we look at this data and are concerned one of these statements is taking longer than expected, and we want to see if it is waiting on anything. So, we take that query and add a join to sys.query_store_wait_stats. Seems simple enough.
--Statement numbers for the last two hours, no aggregation, with wait stats for one statement
SELECT
	qrs.avg_duration * qrs.count_executions AS total_duration,
	qrs.count_executions,
	qrs.avg_duration,
	qsq.query_id,
	qsi.end_time,
	qt.query_sql_text,
	ws.wait_category_desc,
	ws.execution_type_desc,
	ws.total_query_wait_time_ms,
	ws.avg_query_wait_time_ms
FROM sys.query_store_query qsq
JOIN sys.query_store_query_text qt
	ON qt.query_text_id = qsq.query_text_id
JOIN sys.query_store_plan qp
	ON qp.query_id = qsq.query_id
JOIN sys.query_store_runtime_stats qrs
	ON qp.plan_id = qrs.plan_id
JOIN sys.query_store_runtime_stats_interval qsi
	ON qsi.runtime_stats_interval_id = qrs.runtime_stats_interval_id
LEFT JOIN sys.query_store_wait_stats ws
	ON ws.plan_id = qrs.plan_id
	AND ws.runtime_stats_interval_id = qsi.runtime_stats_interval_id
WHERE
	qsq.object_id = OBJECT_ID('Integration.GetStockItemUpdates')
	AND qsi.end_time > DATEADD(day, -2, GETUTCDATE())
ORDER BY
	qt.query_sql_text,
	qsq.query_id,
	qsi.end_time,
	ws.wait_category_desc
And let’s see our results:
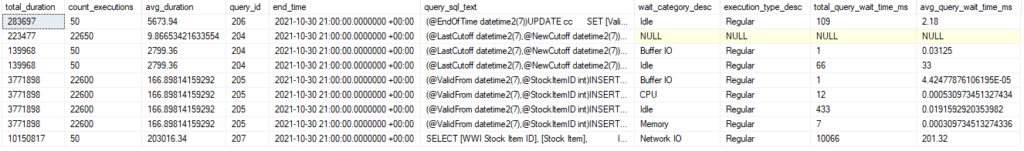
Now we have 9 rows instead of 5. And the number under avg_duration look redundant.
What’s happened, is that sys.query_store_wait_stats has multiplied our result set. Since it stores a record for each wait type observed in each interval, we have multiple combined rows for several of these intervals. And one of our rows would have been removed from this set if we didn’t LEFT JOIN to sys.query_store_wait_stats, since it had no waits.
This is probably not how you would image it to work on first glance. And you might want to pivot those results instead, but the Pivoted Wait Stats view has done that for you.
Using Pivoted Wait Stats
If I take my original query and join to dbo.query_store_wait_stats_pivoted, I will get one row of output for each plan_id and runtime_stats_interval_id.
And the result set will be rather wide. There’s a total and average column for each wait type in sys.query_store_wait_stats. You may or may not want to include all in your query.
So, here’s an example with the average for several interesting wait types:
--Statement numbers for the last two hours, no aggregation
SELECT
	qrs.avg_duration * qrs.count_executions AS total_duration,
	qrs.count_executions,
	qrs.avg_duration,
	qsq.query_id,
	qsi.end_time,
	qt.query_sql_text,
	wsp.Average_BufferIO,
	wsp.Average_BufferLatch,
	wsp.Average_CPU,
	wsp.Average_Lock,
	wsp.Average_Memory,
	wsp.Average_NetworkIO,
	wsp.Average_Parallelism,
	wsp.Average_Tracing
FROM sys.query_store_query qsq
JOIN sys.query_store_query_text qt
	ON qt.query_text_id = qsq.query_text_id
JOIN sys.query_store_plan qp
	ON qp.query_id = qsq.query_id
JOIN sys.query_store_runtime_stats qrs
	ON qp.plan_id = qrs.plan_id
JOIN sys.query_store_runtime_stats_interval qsi
	ON qsi.runtime_stats_interval_id = qrs.runtime_stats_interval_id
LEFT JOIN dbo.query_store_wait_stats_pivoted wsp
	ON wsp.plan_id = qp.plan_id
	AND wsp.runtime_stats_interval_id = qrs.runtime_stats_interval_id
WHERE
	qsq.object_id = OBJECT_ID('Integration.GetSaleUpdates')
	AND qsi.end_time > DATEADD(day, -5, GETUTCDATE())
ORDER BY
	qt.query_sql_text,
	qsq.query_id,
	qsi.end_time

Runtime Stats with Pivoted Wait Stats
We have one record for this query for each of three intervals. In each row, I can see the average wait time for CPU, disk (BufferIO), buffer latch, and other waits. In this case, the largest waits were with NetworkIO. Likely, SSMS was having trouble keeping up with displaying multiple result sets, because I ran this batch 50 times in a row.
One last thing, keep in mind the times from the main tables in Query Store like sys.query_store_runtime_stats are reported in microseconds, while the wait tables are in milliseconds whether you use sys.query_store_wait_stats or dbo.query_store_wait_stats_pivoted. A query that takes 7,000,000 microseconds to run but waited for CPU time for 6,900 milliseconds spent nearly its entire duration waiting.
Don’t forget about PASS Data Community Summit 2021!
PASS Data Community Summit 2021 is next week, and the event is virtual and free, so please go and register if you haven’t already. I’m happy to see PASS and the summit are Red Gate’s hands, and expect it to be a great event.
Many of the sessions, including my session, are prerecorded and can be watched at any time. This should make it easier to get around conflicts between sessions you want to hear. There are also Q&A sessions for the prerecorded sessions, and those are scheduled and live. So get registered and make sure you don’t miss out.
If you have any topics related to performance in SQL Server you would like to hear more about, please feel free to make a suggestion. You can follow me on twitter (@sqljared) and contact me if you have questions.