I’ve discussed the other two join types, so what is the niche for the third?
Before we get into how it works and what my experience is I want to mention a response to my last blog, because it leads into our topic.
Addendum on Hash Match Joins
My last blog post was on hash match joins, and Kevin Feasel had a response on his blog.
Hash matches aren’t inefficient; they are the best way to join large result sets together. The caveat is that you have a large result set, and that itself may not be optimal. Should it be returning this many rows? Have you included all the filters you can? Are you returning columns you don’t need?
Jared Poche
I might throw in one caveat about hash match joins and being the best performers for two really large datasets joining together: merge join can be more efficient so long as both sets are guaranteed to be ordered in the same way without an explicit sort operator. That last clause is usually the kicker.
Kevin Feasel, Curated SQL
And he is quite correct. Nested loops perform better than hash match with smaller result sets, and hash match performs better on large result sets.
Merge joins should be more efficient than both when the two sources are sorted in the same order. So merge joins can be great, but the caveat is that you will rarely have two sources that are already sorted in the same order. So if you were looking for the tldr version of this blog, this paragraph is it.
How Merge Joins Operate
Merge joins traverse both inputs once, advancing a row at a time and comparing the values from each input. Since they are in the same order, this is very efficient. We don’t have to pay the cost to create a hash table, and we don’t have the much larger number of index seeks nested loops would encounter.
The process flows like this:
- Compare the current values from each data source.
- If they match, add the joined row to the result set, and get the next value from both sources.
- If not, get the next row from the data source with the lower sorted value.
- If there are no more rows from either source, the operation ends.
- Otherwise, return to step 1 with the new input.
At this point, I would create a great visual for this, but one already exists. So let me refer you a post by Bert Wagner. The video has a great visualization of the process
Input Independence
I find nested loops is probably the easiest join to understand, so I want to draw a distinction here. Using nested loops, we would get a row from the first source then seek the index against the second to get all rows related to the row from the first source. So, our ability to seek from the second depends on the first.
A merge join seeks from both independently, taking in rows and comparing them in order. So in addition to the requirement (with exception) that the sources have to be in the same order, we need a filter we can use for each source. The ON clause does not give us the filter for the second table, we need something else.
Here’s an example query and plan:
USE WideWorldImporters
GO
SELECT
	inv.InvoiceID,
	invl.InvoiceLineID
FROM Sales.Invoices inv
INNER JOIN Sales.InvoiceLines invl
	ON invl.InvoiceID = inv.InvoiceID
WHERE
	inv.InvoiceID < 50;
GO
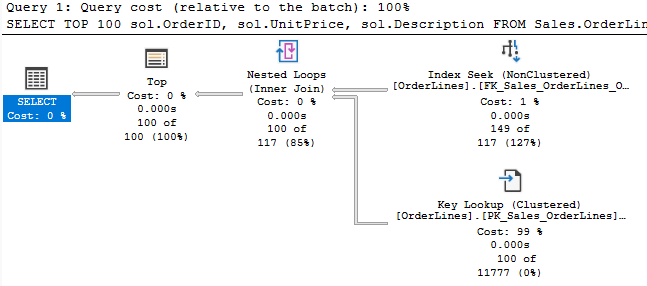
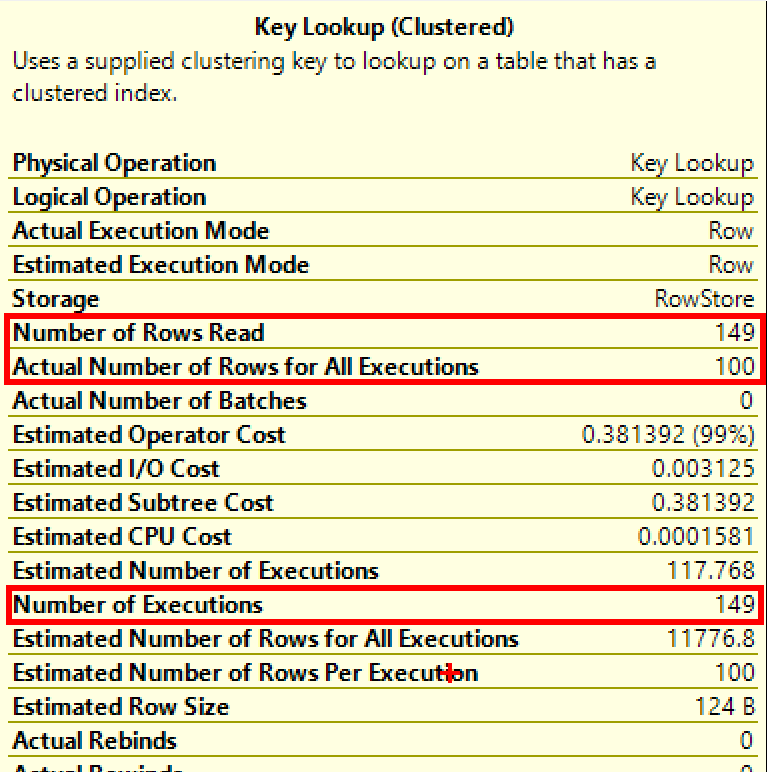
Both Invoices and InvoiceLines have indexes based on InvoiceID, so the data should already be in order. So this should be a good case for a merge (the nested loops below is because of the key lookup on InvoiceLines). But SQL Server’s optimizer still chose nested loops for this query.
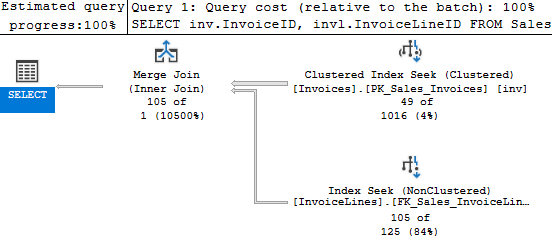
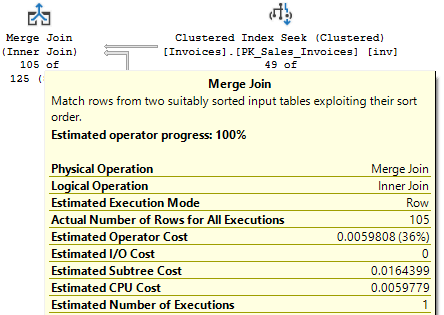
I can hint it to get the behavior I expected, and that plan is below.
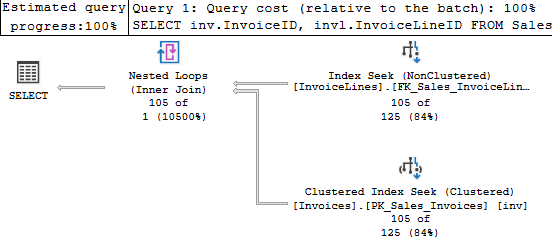
The estimates are way off for the Invoices table, which is odd considering we are seeking on the primary key’s only column; one would expect that estimate to be more accurate. But this estimate causes the cost for the seek against Invoices to be more expensive, so the optimizer chose the other plan. It makes sense.
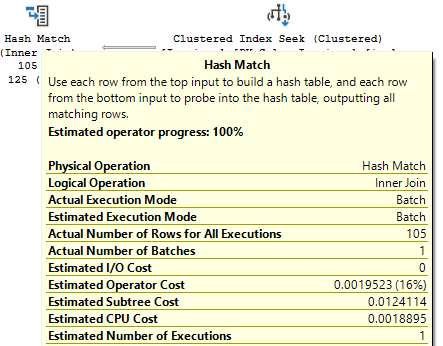
I updated the statistics, and a different plan was chosen. One with a hash match.
???
In that case, the difference in cost was directly the cost of the join operator itself; the cost of the merge join operator was 3x the cost of the hash match operator.
Even if the merge is more efficient, it seems it’s being estimated as being more costly, and specifically for CPU cost. You’re likely to see merge joins much less often than the other two types because of the sort requirement; how it is estimated may also be a factor.
About that sort
The first several times I saw a merge join in an execution plan, the merge was basically the problem with the query. It gave me the impression at the time that merge joins aren’t great in general. But in those cases, the execution plan had a sort after one of the index operations and before the join. Sure, the merge join requires that the two sources be sorted in the same order, but SQL Server could always use a sort operator (expensive as they are) to make that an option.
This seems like an odd choice to make, so let’s consider the following query:
USE WideWorldImporters
GO
SELECT *
FROM Sales.Invoices inv
INNER JOIN Sales.InvoiceLines invl
	ON invl.InvoiceID = inv.InvoiceID
WHERE
	inv.InvoiceDate < DATEADD(month, -12, getutcdate());
GO
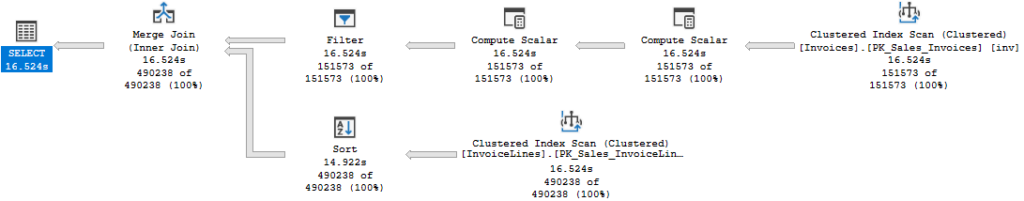
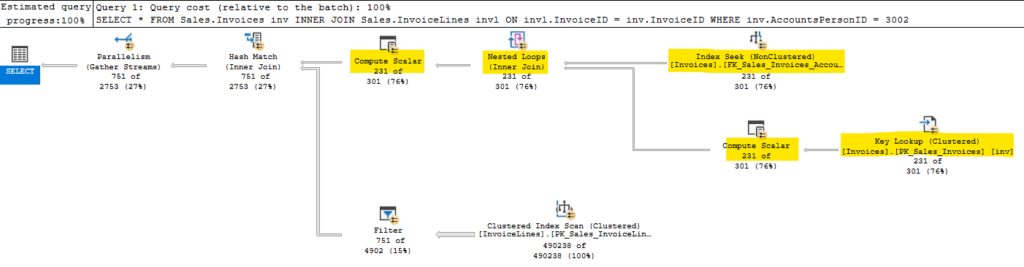
So, this query does a merge join between the two, but there is a sort on the second input. We scan the index, then sort the data to match the other import before we perform the actual join. A sort operator is going to be a large cost to add into our execution plan, so why did the optimizer choose this plan?
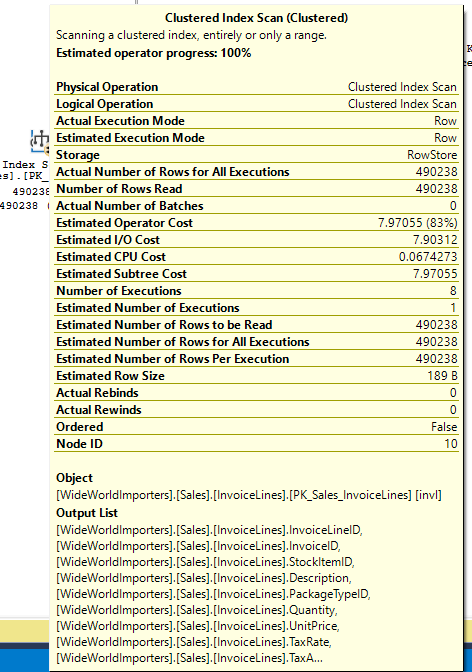
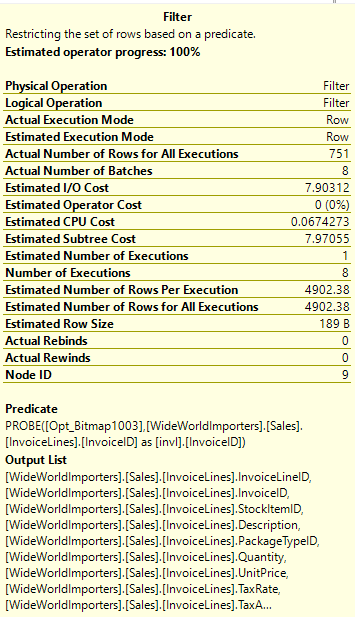
This is a bad query, and the optimizer is trying to create a good plan for it. This may explain many other situations where I have seen a sorted merge. The query is joining the two tables on InvoiceID, and the only filter is on Invoices.InvoiceDate. There is no index on Invoices.InvoiceDate, so it’s a given we’ll scan that table.
If this query used nested loops, we could use the InvoiceID for each record from Invoices to seek a useful index against InvoiceLines, but that would mean we perform 151,578 seeks against that table.
A merge join, even if we have to sort the results from the table, would allow us to perform one index operation instead. But a merge join has to seek independently from the other source, and no other filter is available. So we perform an index scan against the second table as well.
This is probably the best among poor options. To really improve this query, you’d need to add an index or change the WHERE clause.
It took some time for me to realize why I most often saw merge joins in poor execution plans; I wasn’t seeing all the plans using them that perform well. If you are troubleshooting a high CPU situation, when you find the cause you’ll likely be looking at bad plan. We don’t tend to look for the best performing query on the server, do we?
So, if merge join is more efficient than the other two join types in general, we are less likely to be looking at queries where it is being used effectively.
Summary
Hopefully I’ll be getting back to a more regular schedule for the blog. There’s been a number of distractions (an estate sale, mice, etc), but life has been more calm of late (mercifully).
I spoke at the two PASS Summit virtual events over the last two years, and this year I am happy to be presenting in person at PASS Data Community SUMMIT for the first time. So if you are interested in how you can use memory-optimized table variables to improve performance on your system, look out for that session.