In my last post, I spoke about optimizing a procedure that was being executed hundreds of millions of times per day, and yes, that is expected behavior.
The difficult thing about trying to optimize this procedure is that it only takes 2.5ms on average to run. Tuning this isn’t a matter of changing a scan to a seek; we’ll have to look hard to find the opportunities here. A one millisecond Improvement on a procedure running 100 million times a day would save 100,000 seconds every day.
Well, I’ve found a few more options since my last post, and wanted to share my findings.
Setup
The procedure has some complex logic but only runs a few queries.
- There are a few simple SELECT statements to populate some variables. These take a small percentage of the overall runtime.
- There are two UPDATE statements, and we will run one or the other. Both join a table to a table variable; one has a second CTE doing some aggregation the other lacks. The majority of our time is spent running these UPDATEs.
- An INSERT statement that takes place every time. This is to ensure that if we didn’t update a record because it didn’t exist, we make sure we insert the row. It’s very likely on a given run we will INSERT 0 rows.
Brainstorming
Since we 80% of our time in the UPDATE (I love Query Store), that’s the place with the most potential for gain.
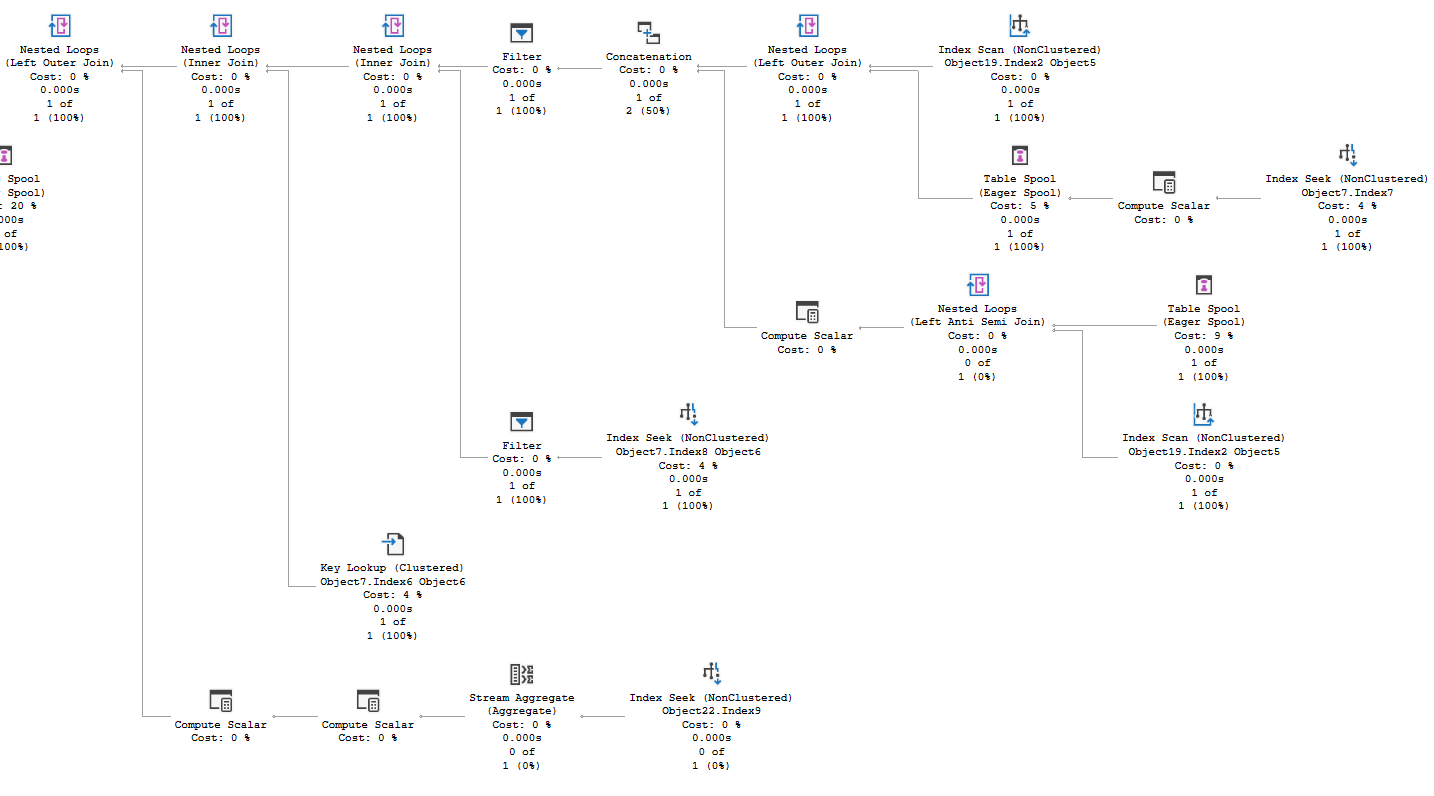
But, on first look (first couple) it seems difficult to see room for improvement here. We’re doing index seeks with small row counts. The index scans are against memory optimized table variables, and you may notice they are cheaper than than the index seeks.
But, looking at plan one thing did draw my attention:

There’s a table spool, and following that I see the plan is updating an indexed view. Which we would do every time there’s an UPDATE. Hundreds of millions of times a day…huh. So, removing the index on that view would eliminate this entire middle branch from the plan.
The view is based on two columns that are the first two columns of the clustered PK of the underlying table. The view does some aggregation, but the difference between querying the view or the table is reading 1 row versus maybe 2 or 3 rows, most of the time. Dropping that index seems like a good thing to try.
And I did mention this in my last blog post, but we perform the INSERT statement every execution of the procedure, and we run the trigger on this table even if we inserted 0 rows. So, if we can detect whether the INSERT is needed, we can potentially skip the majority of the executions of the statement and the trigger.
The logic for the procedure uses a TVP and a couple of table variables, which isn’t optimal. SQL Server doesn’t have statistics on table variables, so it’s not able to make good estimates of how many rows are going to be returned (unless you are using table variable deferred compilation in SQL Server 2019). We could change these to temp tables, and see if we have better results. Hopefully, we’ll have a more stable plan across the many databases running it.
Both of the UPDATE statements have a bookmark lookup. We’ll be looking up only a few rows, but this could be a significant improvement for a query that takes so little time. Also, one of the UPDATE statements references the main table an additional time in its CTE. So we have two index seeks plus the key lookup. How much of our time is spent in the second access and the bookmark lookup?
Results
first change
I’ve been working on releasing these changes individually, and the first one is complete. Removing the index on the view, resulted in a 17% reduction in the duration of the procedure (from 2.34ms to 1.94ms), and a 20% reduction in CPU. Come to think of it, not having to update that index would have helped with our INSERT statement as well.
I’ll update this post once I have details on the other changes.
If you liked this post, please follow me on twitter and contact me if you have questions.
Updates
Second change
So, the second idea I’ve tried on this issue, is replacing the table variables with temp tables. The idea was that temp tables have statistics and table variables don’t, so we should tend to have better execution plans using temp tables. However, it didn’t work out that was in this case because it also caused pagelatch contention in tempdb.
Tempdb pagelatch contention is a very well documented issue. There are things you can do to mitigate this issue, but at a certain point you just need to create fewer temp tables. I’m not sure where the line is in the case of my environment, but it was clear that creating 3 temp tables in a proc running this often crosses that line.
This change has been reverted, but I’ll update this post again shortly. I should be making the change to skip unnecessary INSERT statements this week.
Skipping Inserts
This change has been made, and the results are fairly minor. The first measure I took showed the average duration of the proc dropping from 1.95 to 1.91 ms, but this varies enough from day to day that I could cherry pick numbers and get a different, even negative improvement.
This confirms something interesting. The cost of the procedure overall was skewed very heavily to the UPDATE statements, with the INSERT being significantly less. The most expensive operator in a DML operation is typically the Insert\Update\Delete operator itself; the step where we actually change data. My expectation all along has been that there were very few rows actually being inserted by our INSERT statement. It seems this is true and since the statement doesn’t actually insert data, the Insert operator doesn’t do work or take any significant amount of time. So we gained very little by this change, at least from the procedure.
This change also prevented us from calling the trigger with empty inserts, so we saw the trigger drop from executing ~350 million times per day to 6 million. This saves us about 14,000 seconds per day. I don’t think about context switching in the context of SQL Server very often, but in addition to the time benefit, there’s a small benefit in just not having to set up and switch to the context for the trigger itself.
Overall a small victory, but I’ll take it.
Pending
I should have my final update on this topic in the next week. This will change the logic of one of the UPDATE statements to remove an unnecessary CTE which references the main table, and adds an index hint to use the primary key, removing a bookmark\key lookup from both statements. The first update hits the table twice (once for the nonclustered, another for the key lookup) and the second hits it thrice (because of the CTE), but this change will drop both to 1 access of the PK, and should only query a few rows.
I’m very interested to see how this affects performance, as this should affect the largest part of work done outside of the actual Update operator in those statements.
Finale
So my change to the UPDATE statement is out, and the results are pretty good. First, The runtime of the procedure has dropped to 1.399 ms. If you recall, it originally took about 2.5 ms, so we’ve dropped this overall by more than 1 millisecond, which would be 40% of its original runtime.
Second, I love the simplicity of the new plan. The previous anonymized plan is at the top of this post; it took 2 screenshots to cover most of it. In particular, I noticed we were hitting the central table 3 times. Once in a CTE that was doing aggregation that was unnecessary, I removed that entirely. The second reference was in the main query, and it caused a key lookup which was the third access. I hinted our query to use the clustered primary key, which leads with the same two columns that are in the nonclustered index the optimizer seems to prefer.

The index scans are both in memory optimized table variables, and you can see the estimates are lower than accessing the main table in the clustered index seek. I also love seeing that the actual update operator on our left is such a large amount of the effort; that’s what I expect to see on a DML operation that’s tuned well.
In summary
I had 4 ideas originally to tune this query. I wanted to see if we could drop it by 1 millisecond, and we gained 1.1.
- Removing the index from an indexed view referencing this table had a significant effect. This required a significant amount of research, as I had to find all the places where we referenced the view and determine if any would experience significantly worse performance without the aggregation from that view. I didn’t see any red flags, and this changed dropped the procedure’s duration from 2.5ms to 1.94ms (22% reduction).
- The procedure uses a few in memory table variables with temp tables. The idea is that temp tables have statistics. That could lead to SQL Server making better plans, because it can estimate how many rows are in a given operation. This would work in other cases, but not for a proc that runs this often. Performance was actually slowed because of significant PAGELATCH waits. Every execution we were creating multiple temp tables, and at this pace our threads were constantly waiting on key pages in tempdb. This change was reverted.
- Reducing the INSERTs was a gain, but a minimal one. The INSERT statement itself took very little of our time in the procedure. We also got to skip running the INSERT trigger, but that also did not take long to run. It’s possible we ended up with less waiting in the main table, or the table our trigger was updating, but if so the gains were too small to quantify.
- Simplifying the logic of the two UPDATE statements that were taking most of the time in the procedure was a success. We went from 3 operations on the only permanent table in our query to 1, and removed an aggregation step we didn’t need. This dropped our runtime from 1.94ms to 1.399ms (27.8%). Every operation counts.
Hopefully you’ve learned something from this post and its updates. If so, please follow me on twitter or contact me if you have questions.
 We’re scanning and returning 1.4 million rows from the first table, doing a key lookup on all of them. We scan another table to look up the retention period for the related account, as this database has information from multiple accounts, and return 8.4 million rows there. We join two massive record sets, then have a filter operator that gets us down to a more reasonable size.